Mapping time/charting space
The challenge
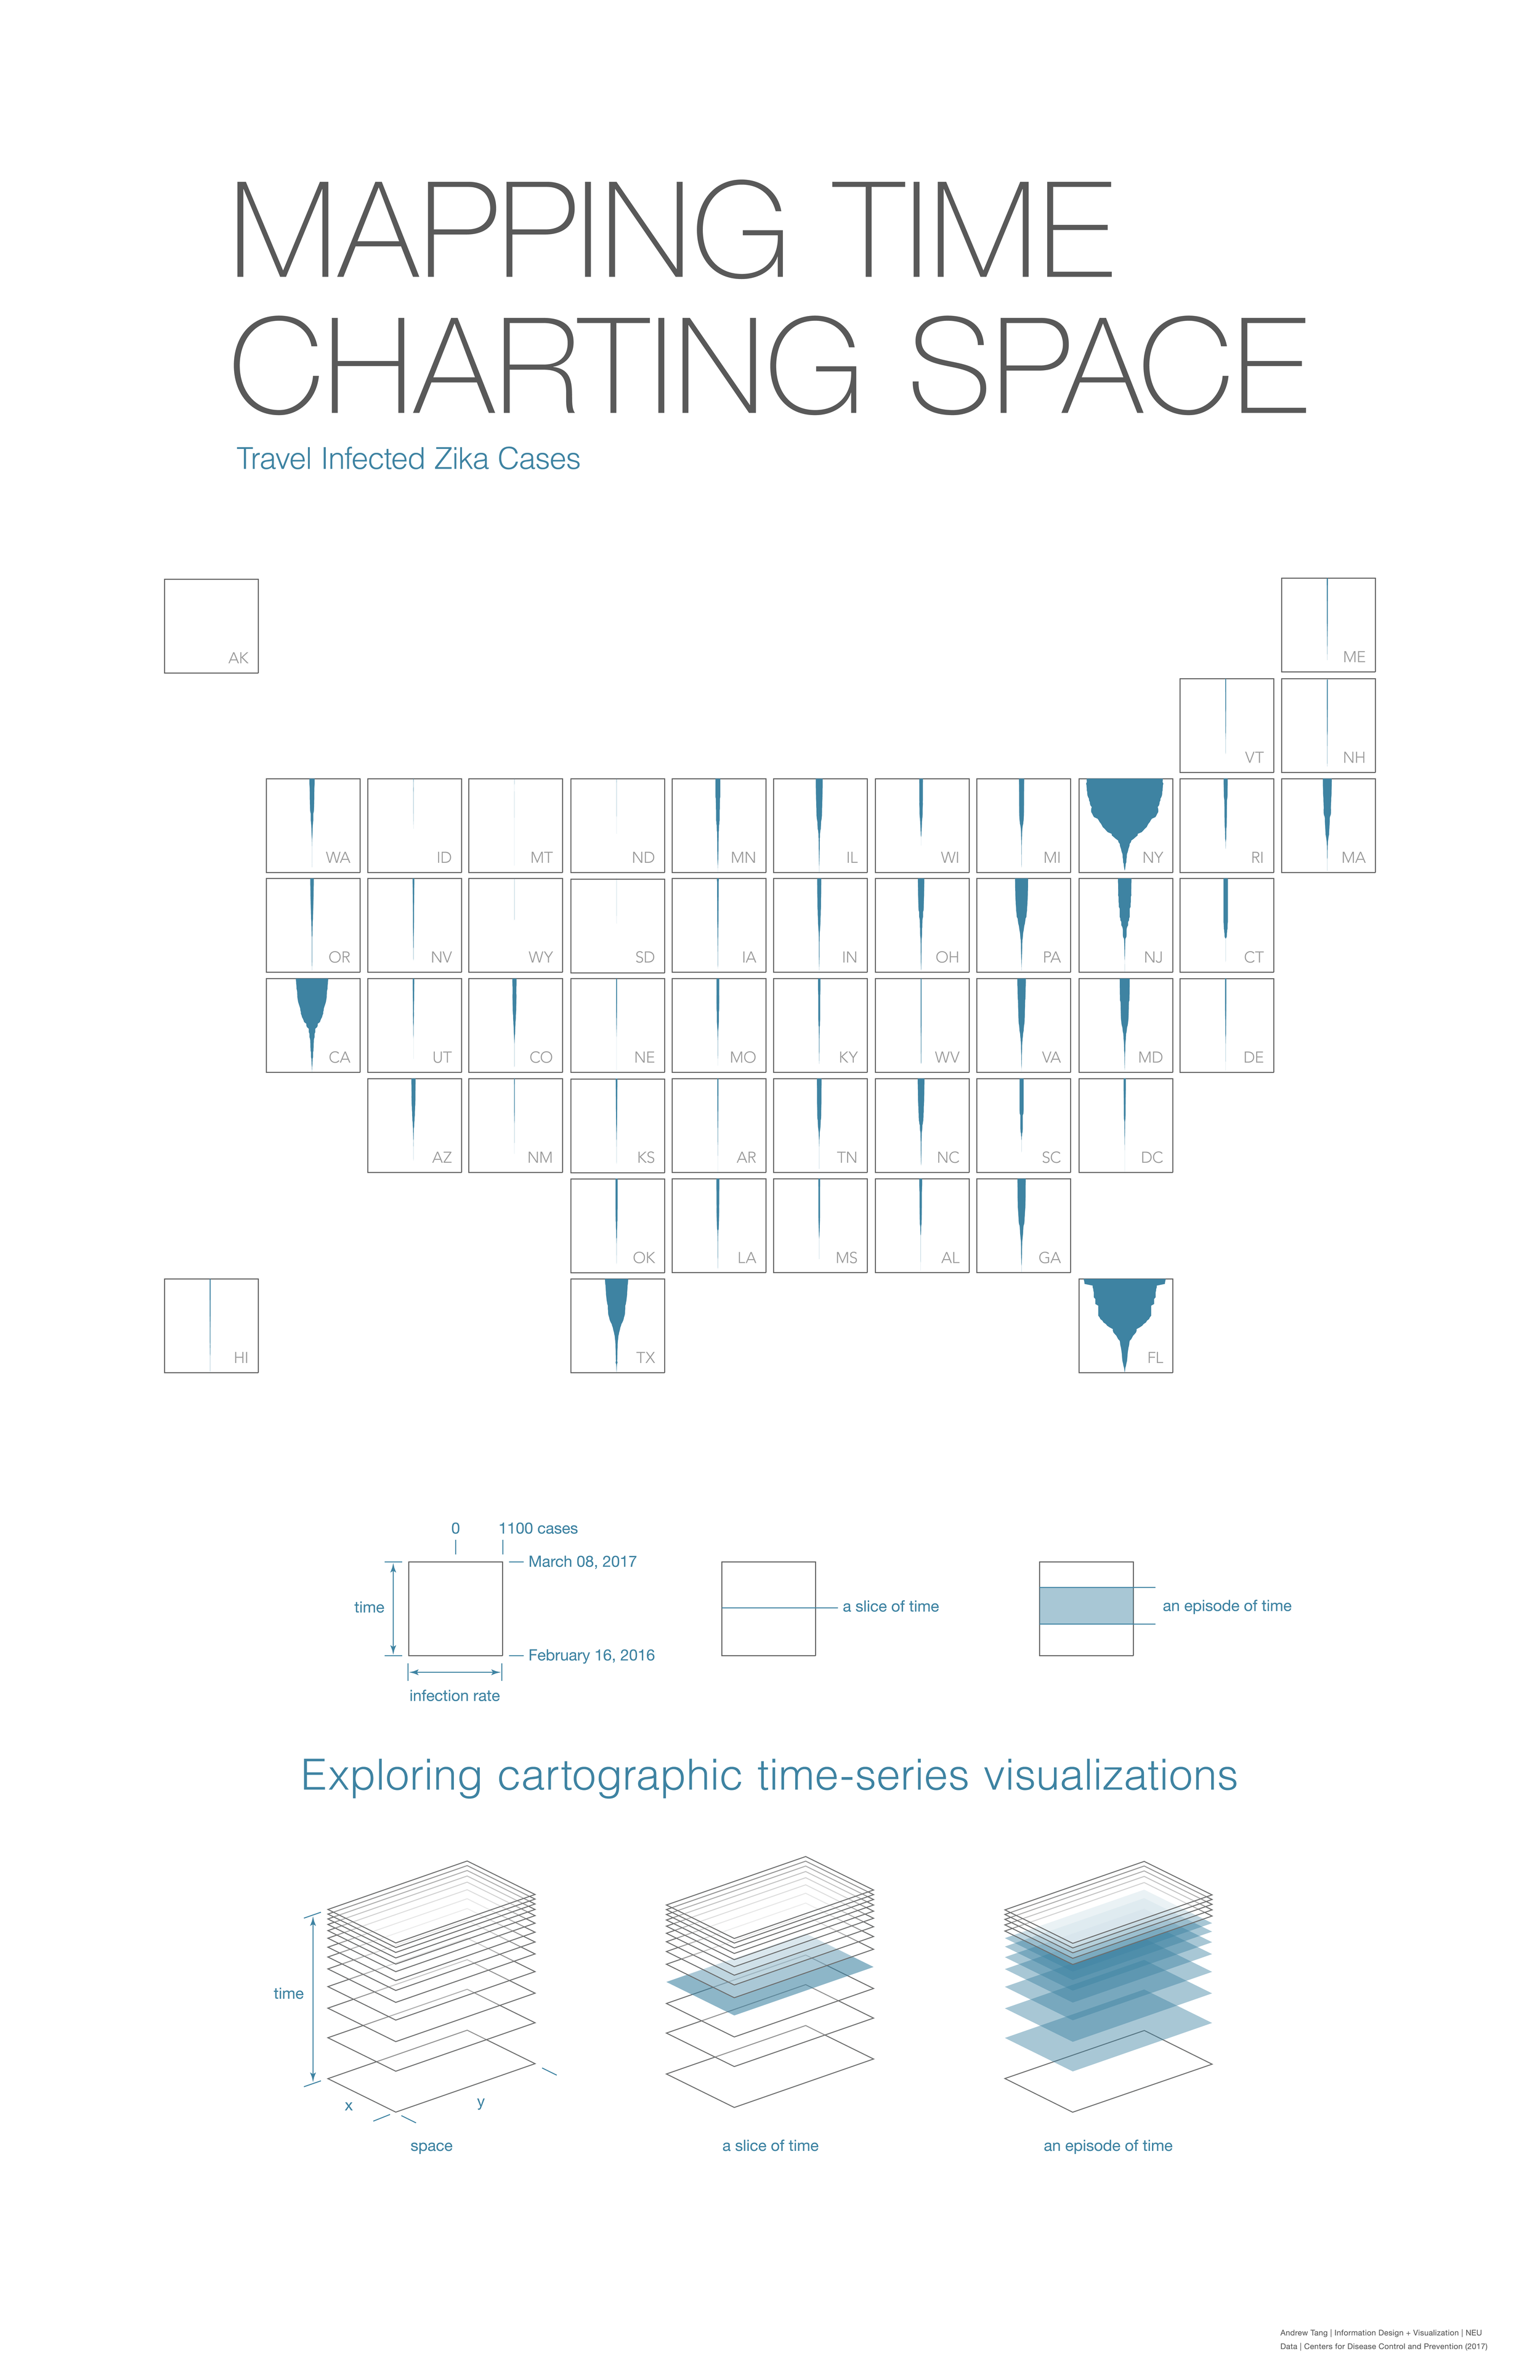
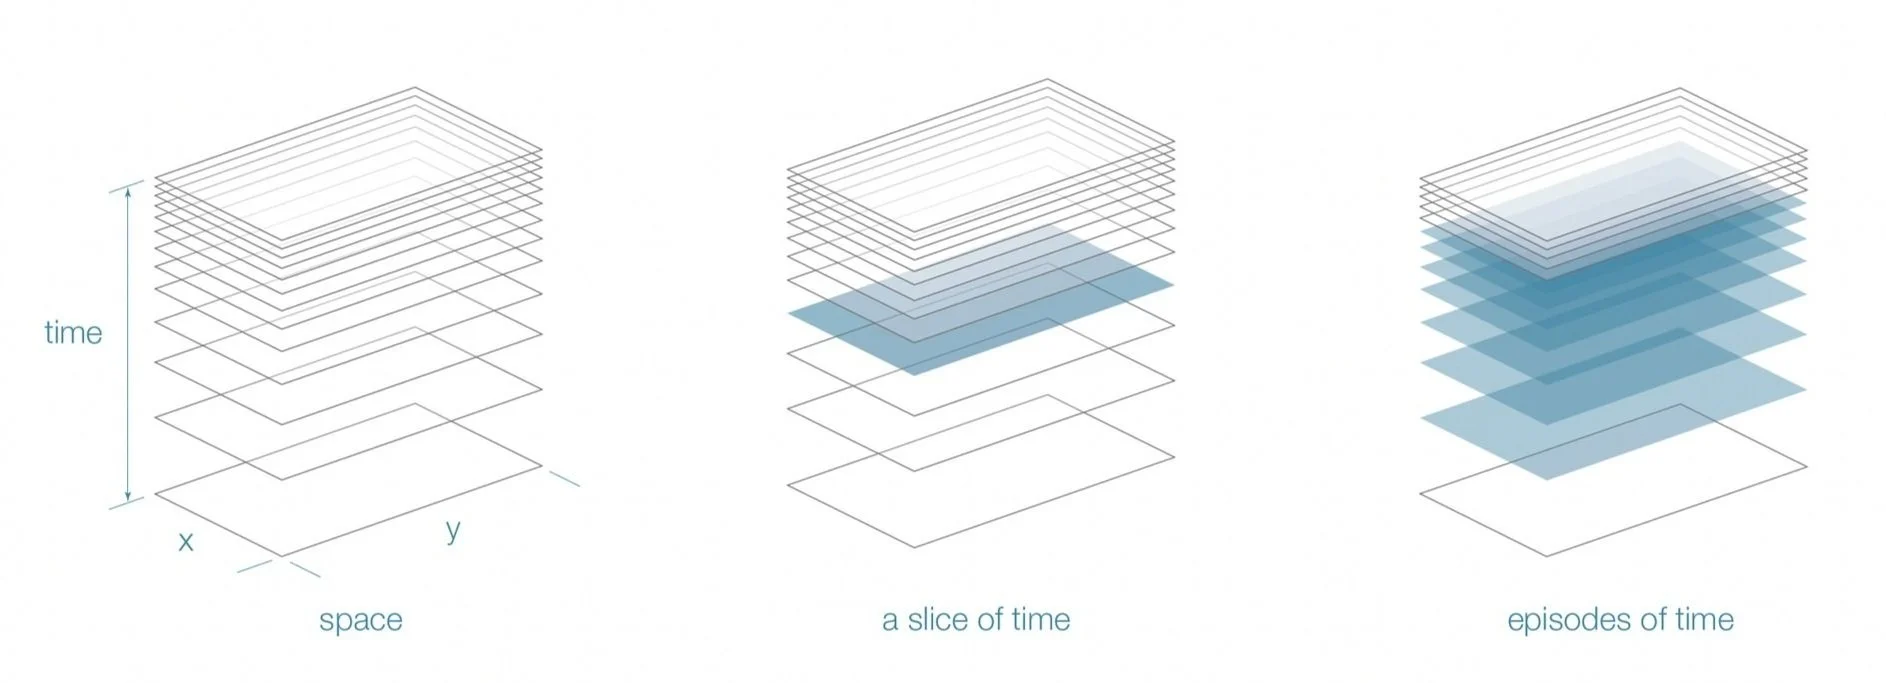
Showing changes through time that are related to geographic space usually entails multiple views, either statically as small multiples or dynamically as an animated interactive. This visualization concept will attempt to present time-series events in a singular view, to show the breadth of the changes through time in one static view. Being able to show time-series events statically and efficiently can greatly improve the spread of information, as the viewer can quickly grasp the entirety of the information being conveyed.
Visualizing travel transmission of the Zika outbreak

Types of cartographic representation
Single static map
A single static map represents a single event or episode. Graphic variables are used to reproduce information displaying value, size, and directionality.
Strip map
Each individual map in a small multiple is essentially a single static map since the graphic elements are used to show the same variables while time is portrayed in the sequential succession in the collective of the small multiples.
Animated map
An animated map is a dynamic version of a strip map, but at each distinct view it acts like and presents the same information as the single static map. The visual variables are the same as the single static map and is not used to portray time. Temporal information is depicted through the animation.
Representations of events of time
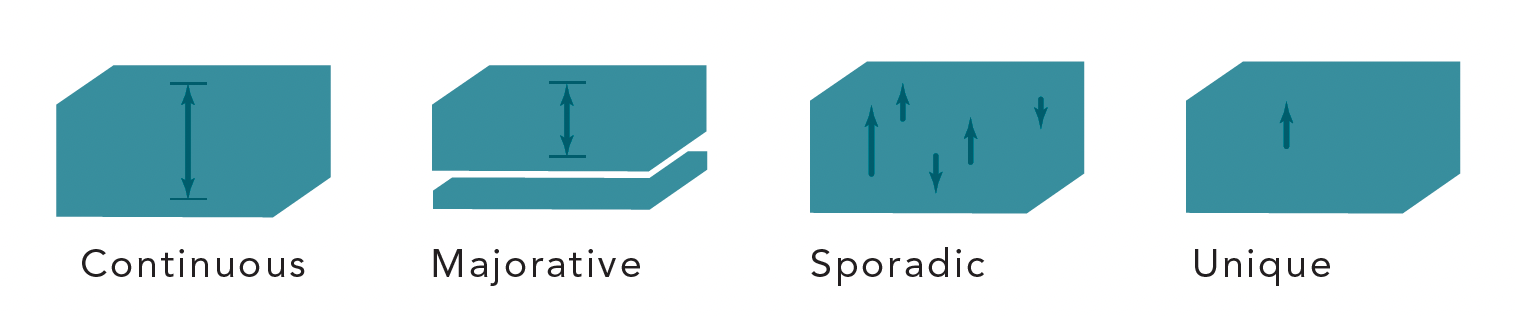
The increased need to represent time as a variable has led the GIS community to further abstract and define the effects of time in cartographic space. Gail Langran (PhD, University of Washington) extends cartographic theory past the traditional visual language of using graphic symbols to represent changes over time. By defining relative domains to create a shared language between spatial and temporal data, he has introduced dynamic relationships by categorizing cartographic time as events.
Continuous - going on throughout some interval
Majorative - going on most of the time
Sporadic - occurring some of the time
Unique - occurring only once
Duration and frequency are inherent qualities in measuring and monitoring contagion. The timeline of this life span does not just start at the tipping point of the diffusion of an infectious virus, but at the onset of an initial infection.
Duration consists of the life span and an epidemic.
Frequency defined by the CDC is a measure of central location that provides a single value that summarizes an entire distribution of data. Common frequency measures are ratios, proportions, and rates.