

IBD clinical trial mobile app
GutSee mobile app
Building user engagement for a longitudinal IBD clinical study
The background
The Center for Microbiome Informatics and Therapeutics (CMIT) is collaborating with Massachusetts General Hospital (MGH) in Boston, and the University Medical Center, Gröningen, the Netherlands, on an observational longitudinal study with the goal of identifying early warning signs of IBD flare-ups. The study is set to monitor patients with either Crohn’s Disease or ulcerative colitis over the course of 12 months, patients are expected to contribute samples (stool, blood, and urine) and physiological and behavioral data from a Fitbit wearable device. The goal of the study is to identify early warning signs of IBD flare-ups.
We designed a patient-facing app called GutSee to help study participants submit samples, record disease symptoms, monitor wearable device data, and visualize their own microbiome sequencing results as they become available.
Challenge
User Confidence
Can users trust this tool with their medical data?
How can design influence the notion of trust?
User Experience
Does the app set the correct level of expectations for the user?
How to keep users engaged for the whole trial period?
User Interface
Can the app bring value to the users?
Is the app easy to navigate?
Can a user quickly fill out the IBD survey and submit a sample?

The results
The process
I first reviewed applications in this space as a competitive analysis. The main purpose of the app is to capture irritable bowel disease samples and symptoms at occurrence, track physiological data through a wearable device and return medical information to patients. I reviewed apps in three areas:
IBD related apps - to learn what types of information is valuable for users of IBD apps
Health tracking apps - to learn the level of data fidelity that would keep users engaged
Medical patient facing apps - to learn the type of content and context to relate medical information to patients, and what literacy level we should be conveying this type of information.
Branding
We ran a brain storming session across the team and with our collaborators, and create a word index to generate ideas.

The name GutSee won by a few votes as Bowl Owl was a close second. From there I was able to design the logo and logotype for the app. The colors of the logo were taken from the colors of the center.


The data
We had three types of data to record and return to the patients.
Survey data
The surveys themselves were medically reviewed and approved IBD standards, and depending on which study the patients were involved in dictated the survey that we would present to them. The surveys had to be filled out when there was a flare-up to capture data at the time of occurrence.
Ulcerative Colitis, Simple clinical colitis activity index (SCCAI) survey
Crohn’s Disease, Harvey-Bradshaw index (HBI) survey
Fitness data
Each patient received a Fitbit upon inclusion into the study group. We recorded specific types of physiological data defined by the clinicians.
Number of steps
Active time
Resting HR
Sleep time
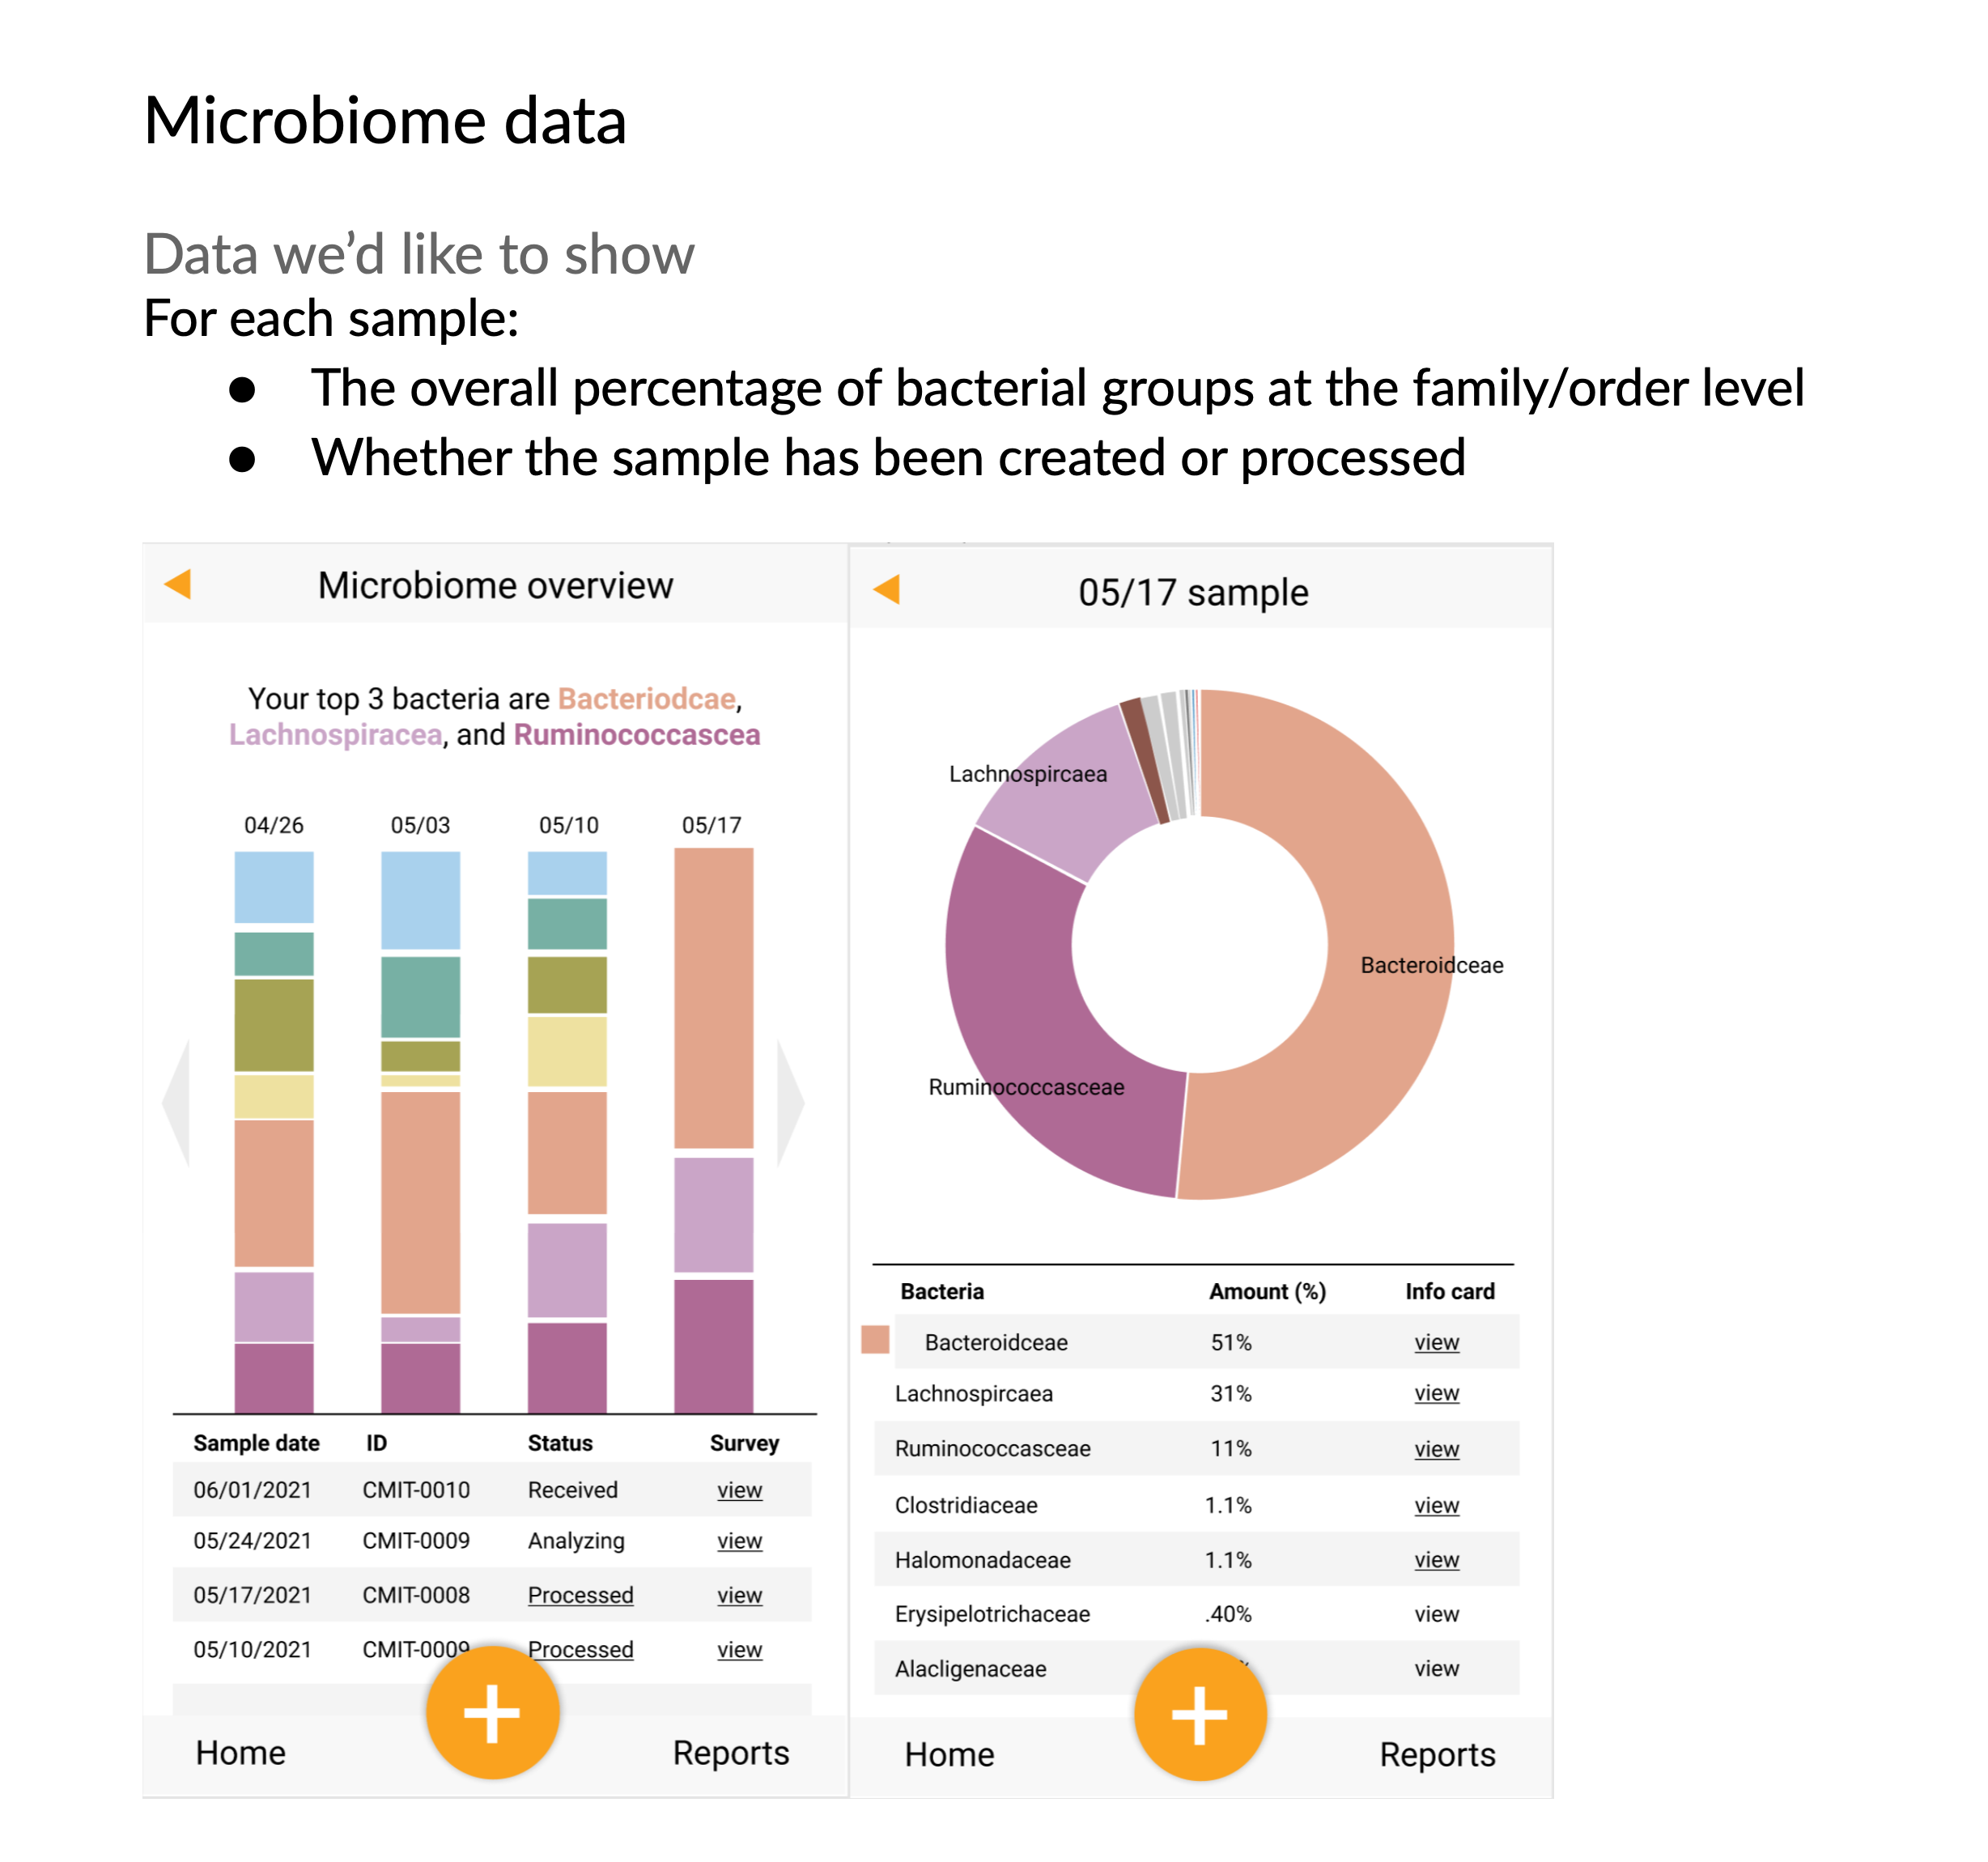
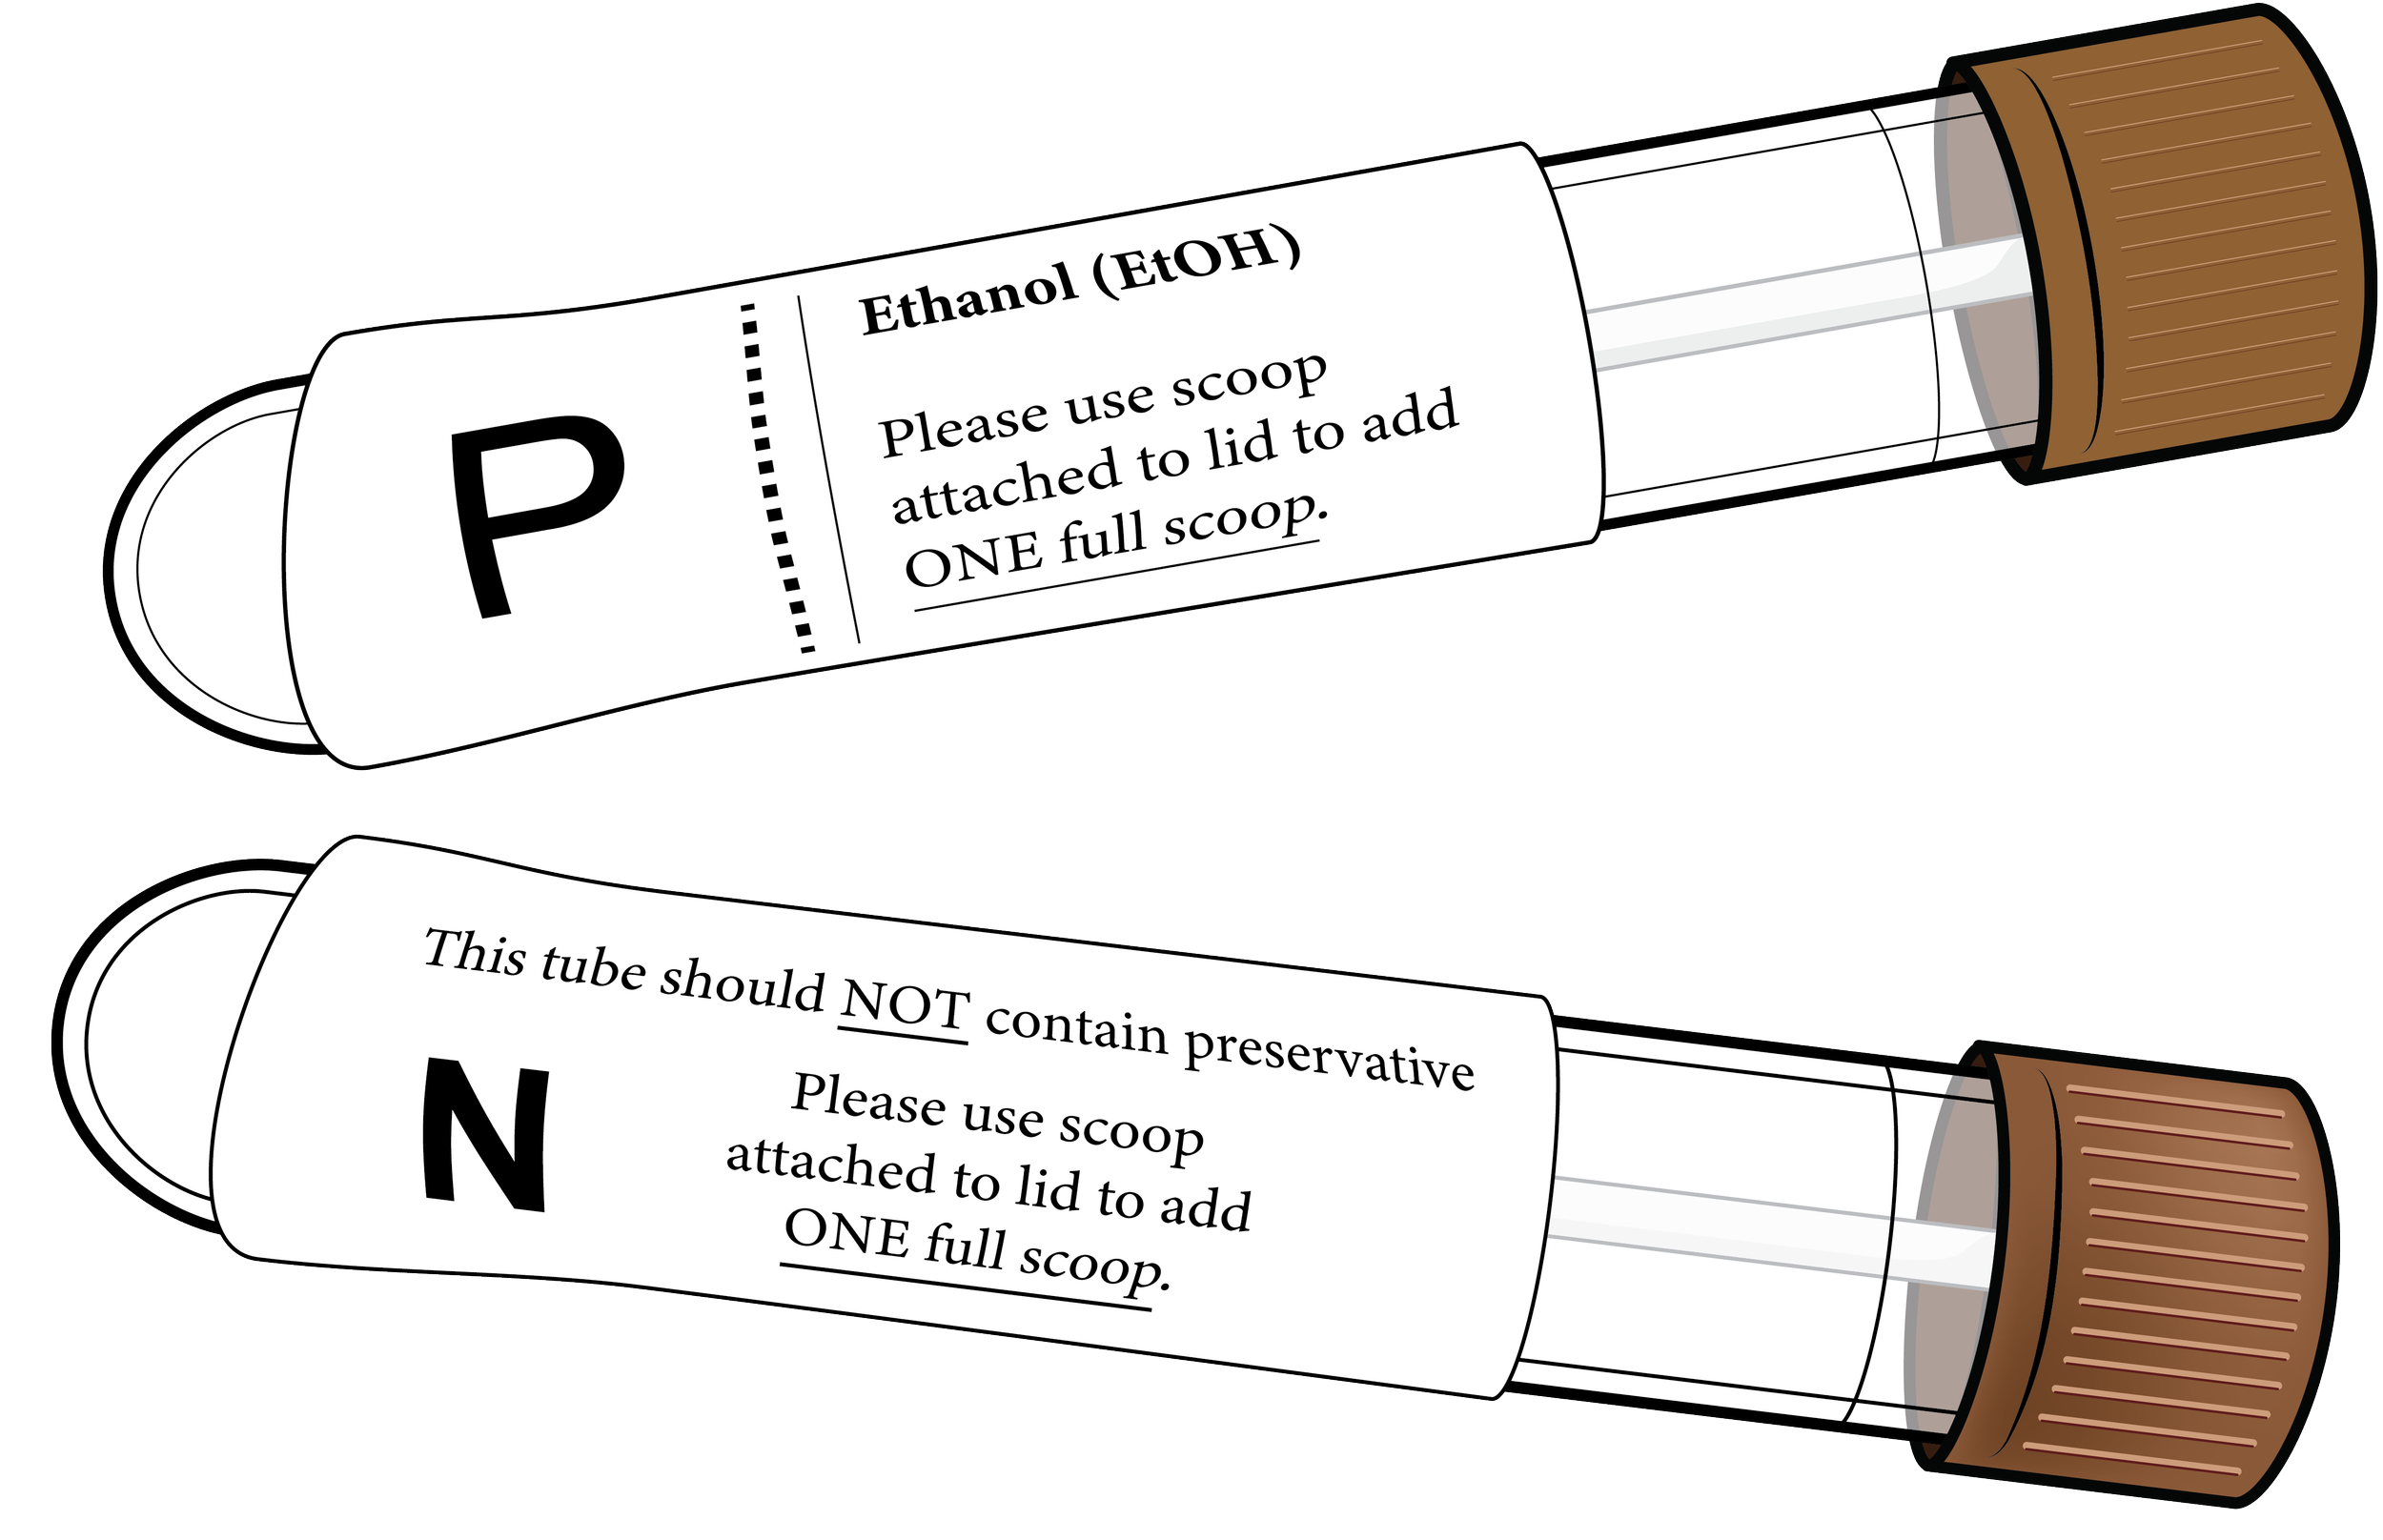
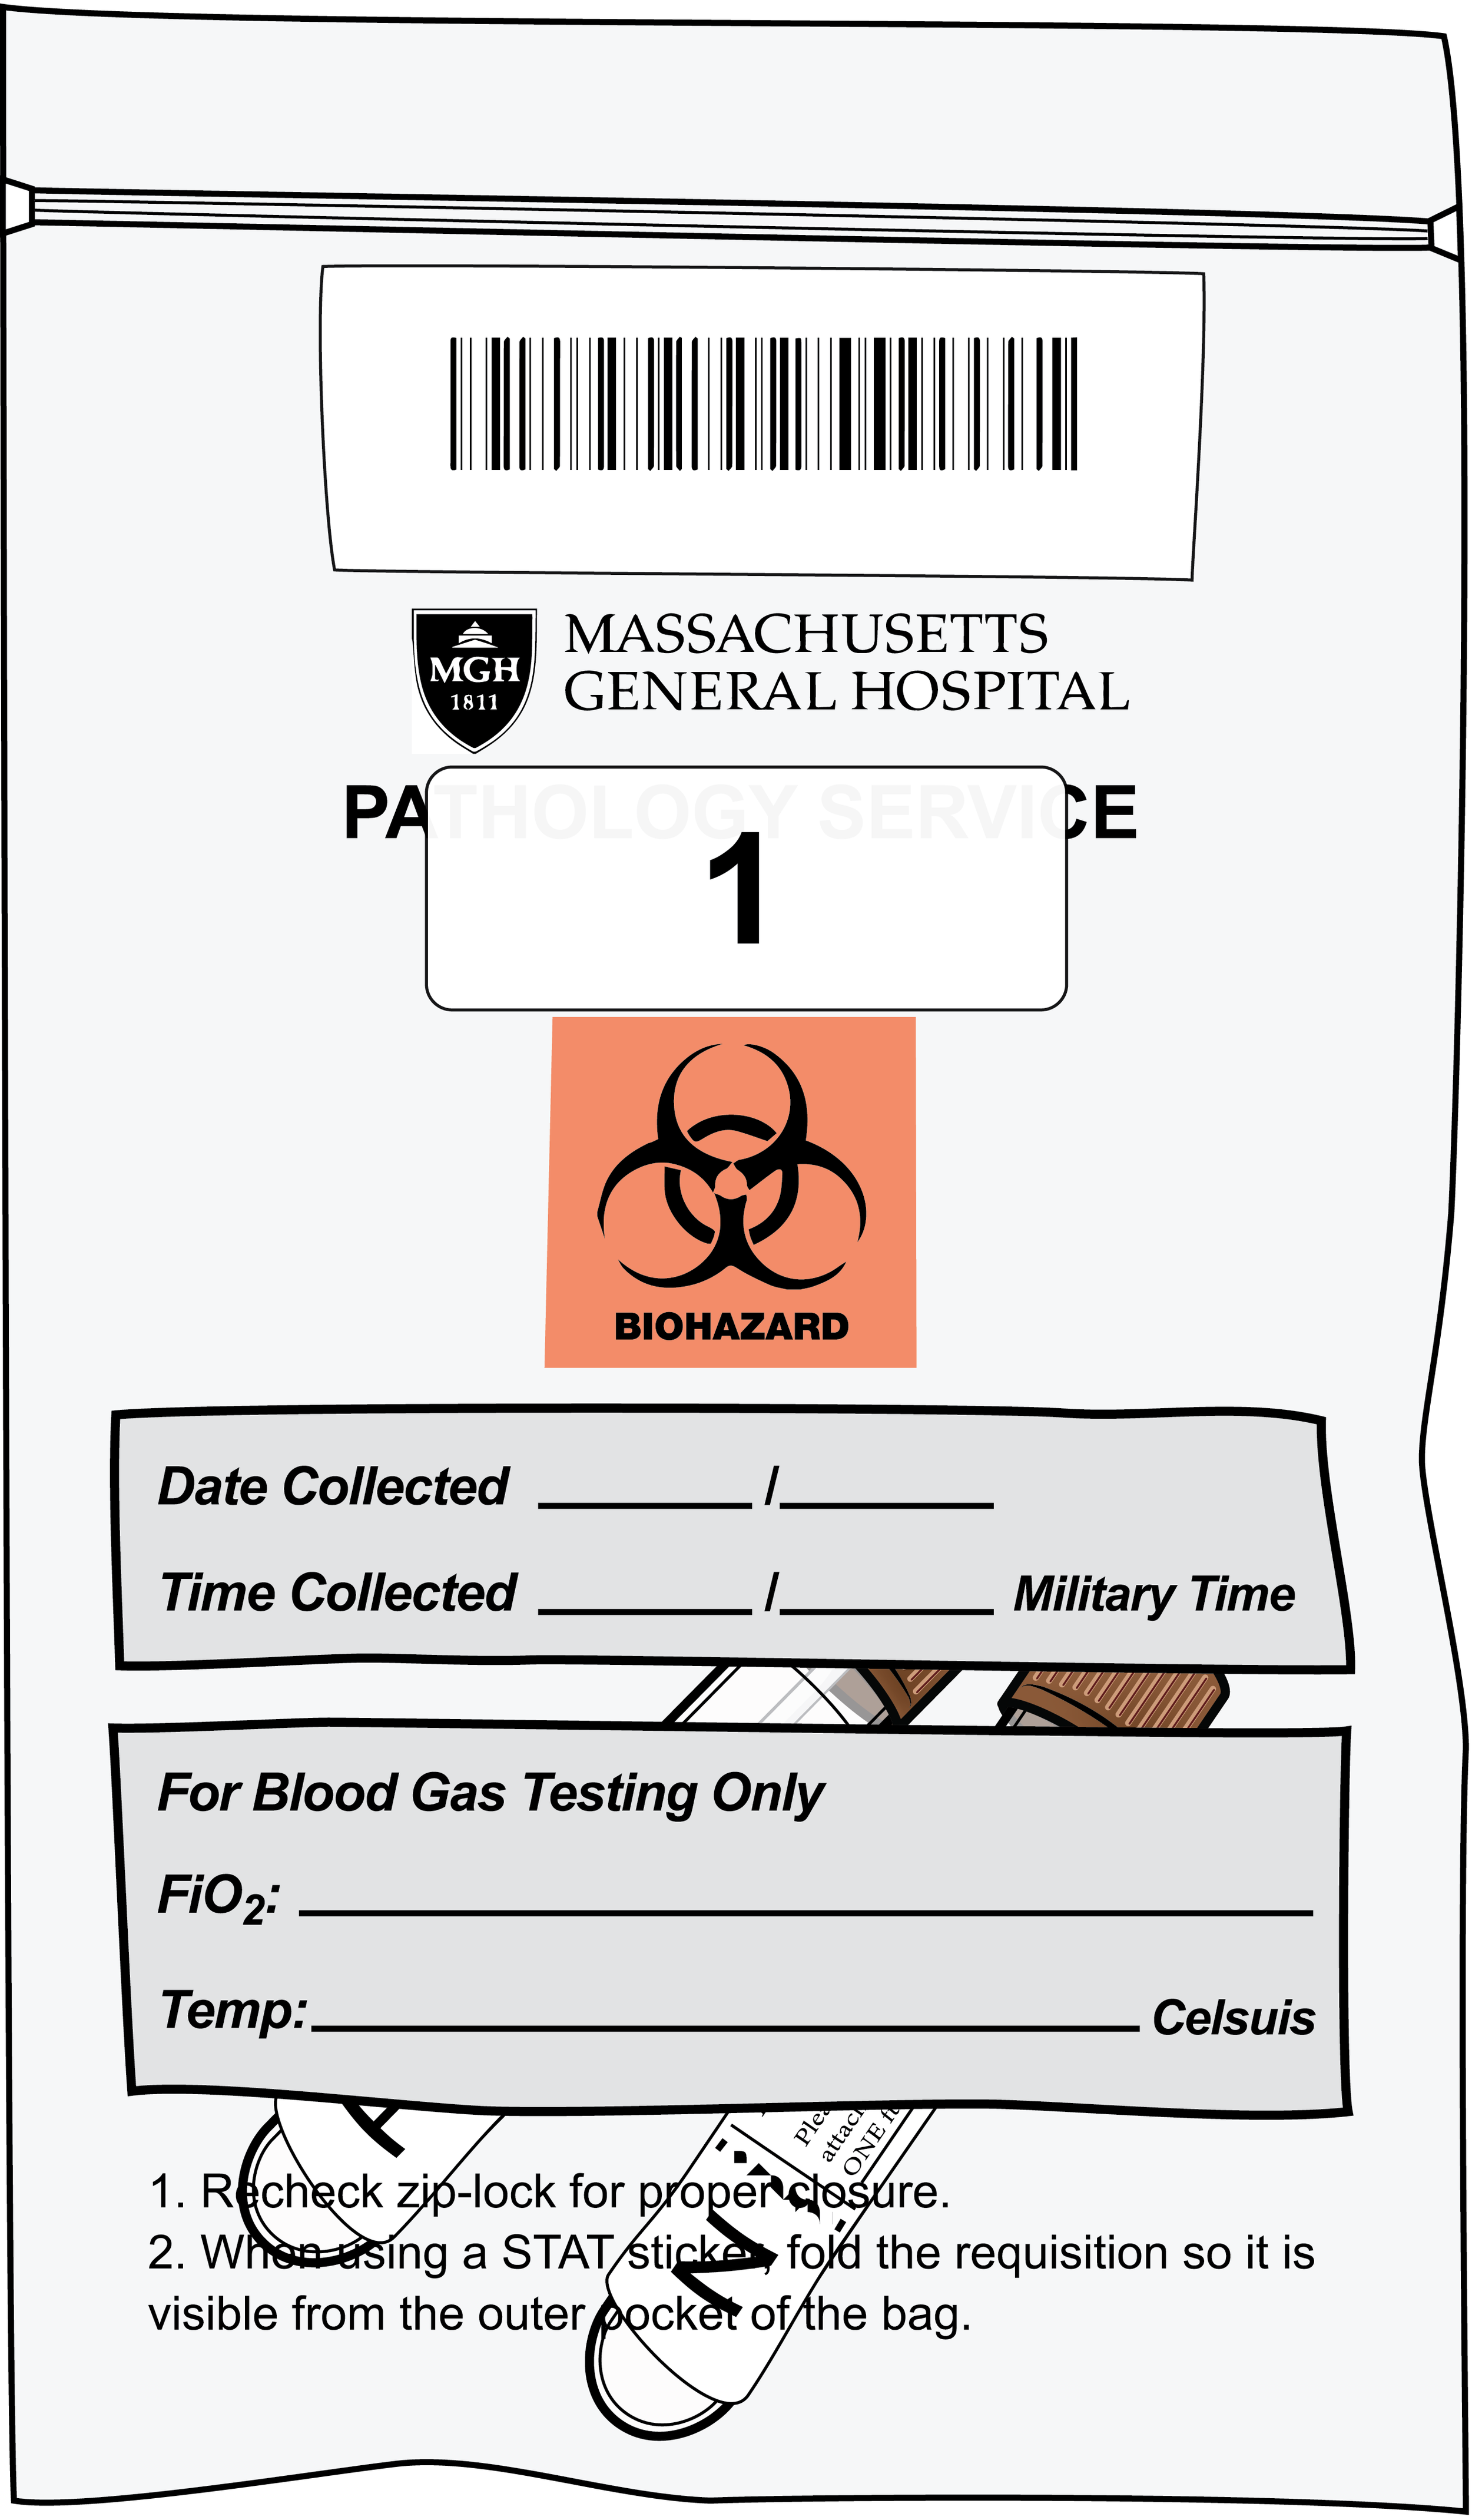
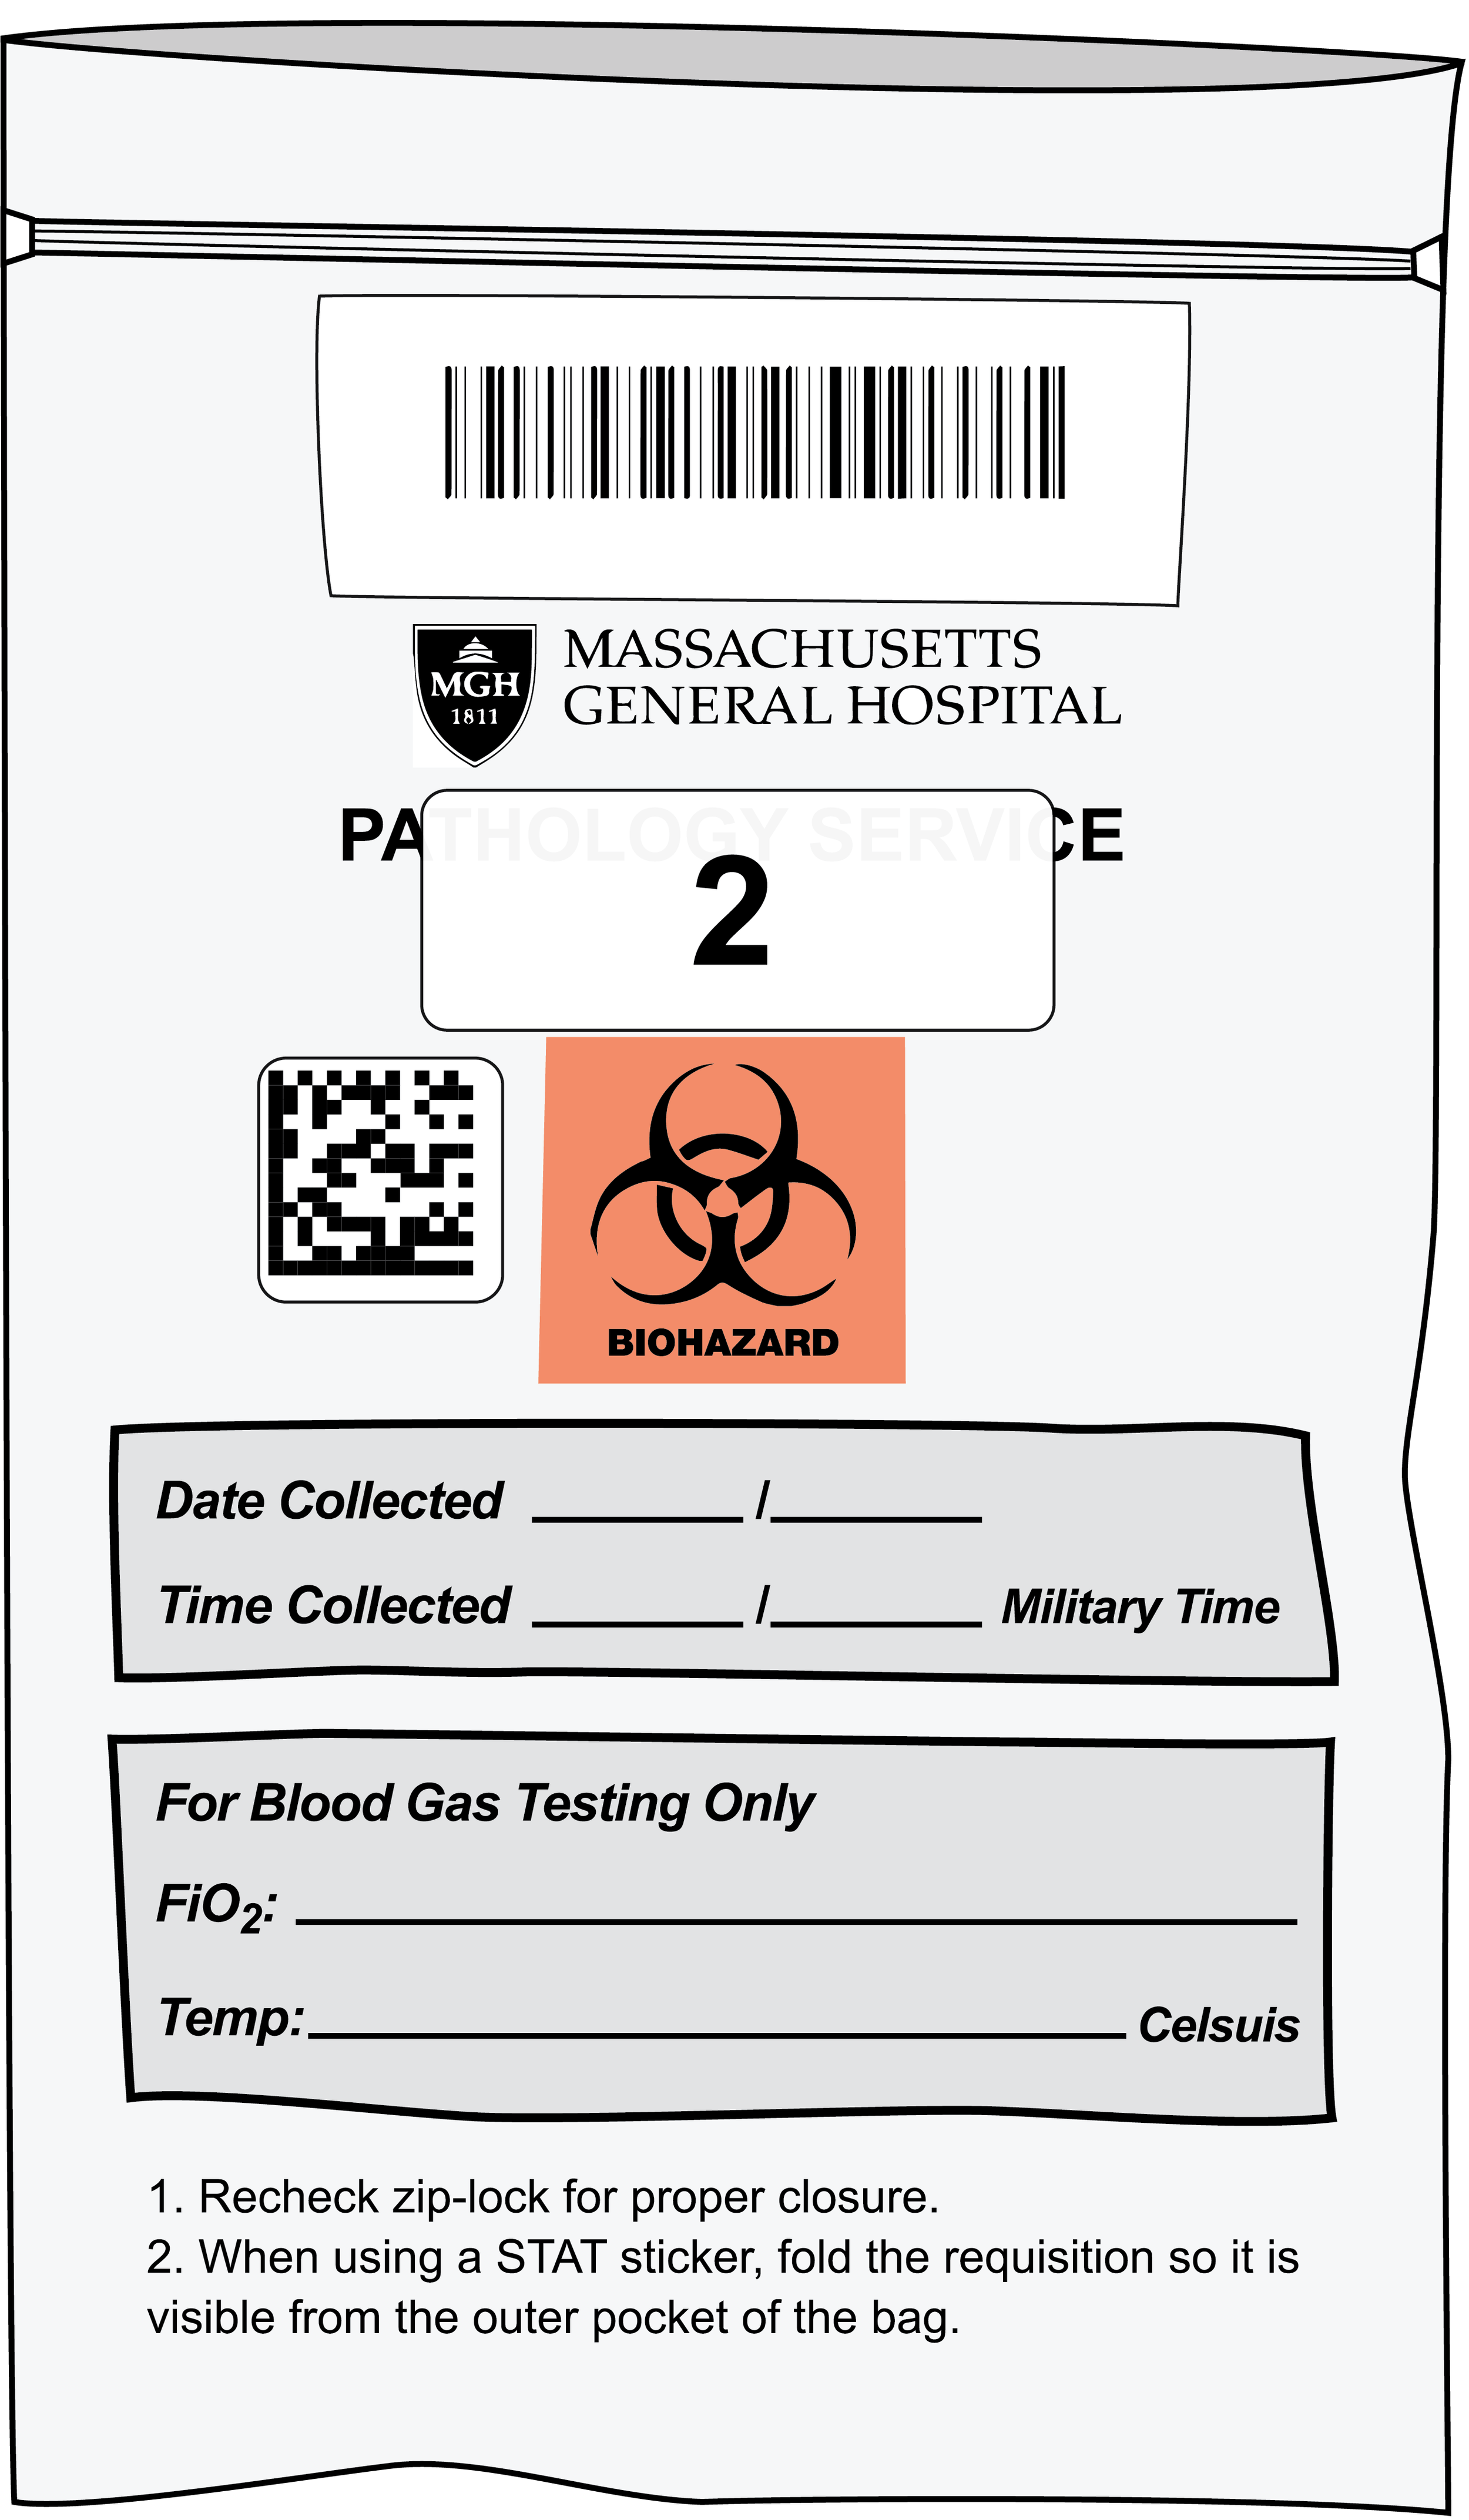
Microbiome samples
Patients had to submit weekly samples to obtain a baseline for their microbiome, and in cases of flare-ups users would be request to submit additional samples to measure the bacteria during an occurrence.
Abundance of bacteria per sample
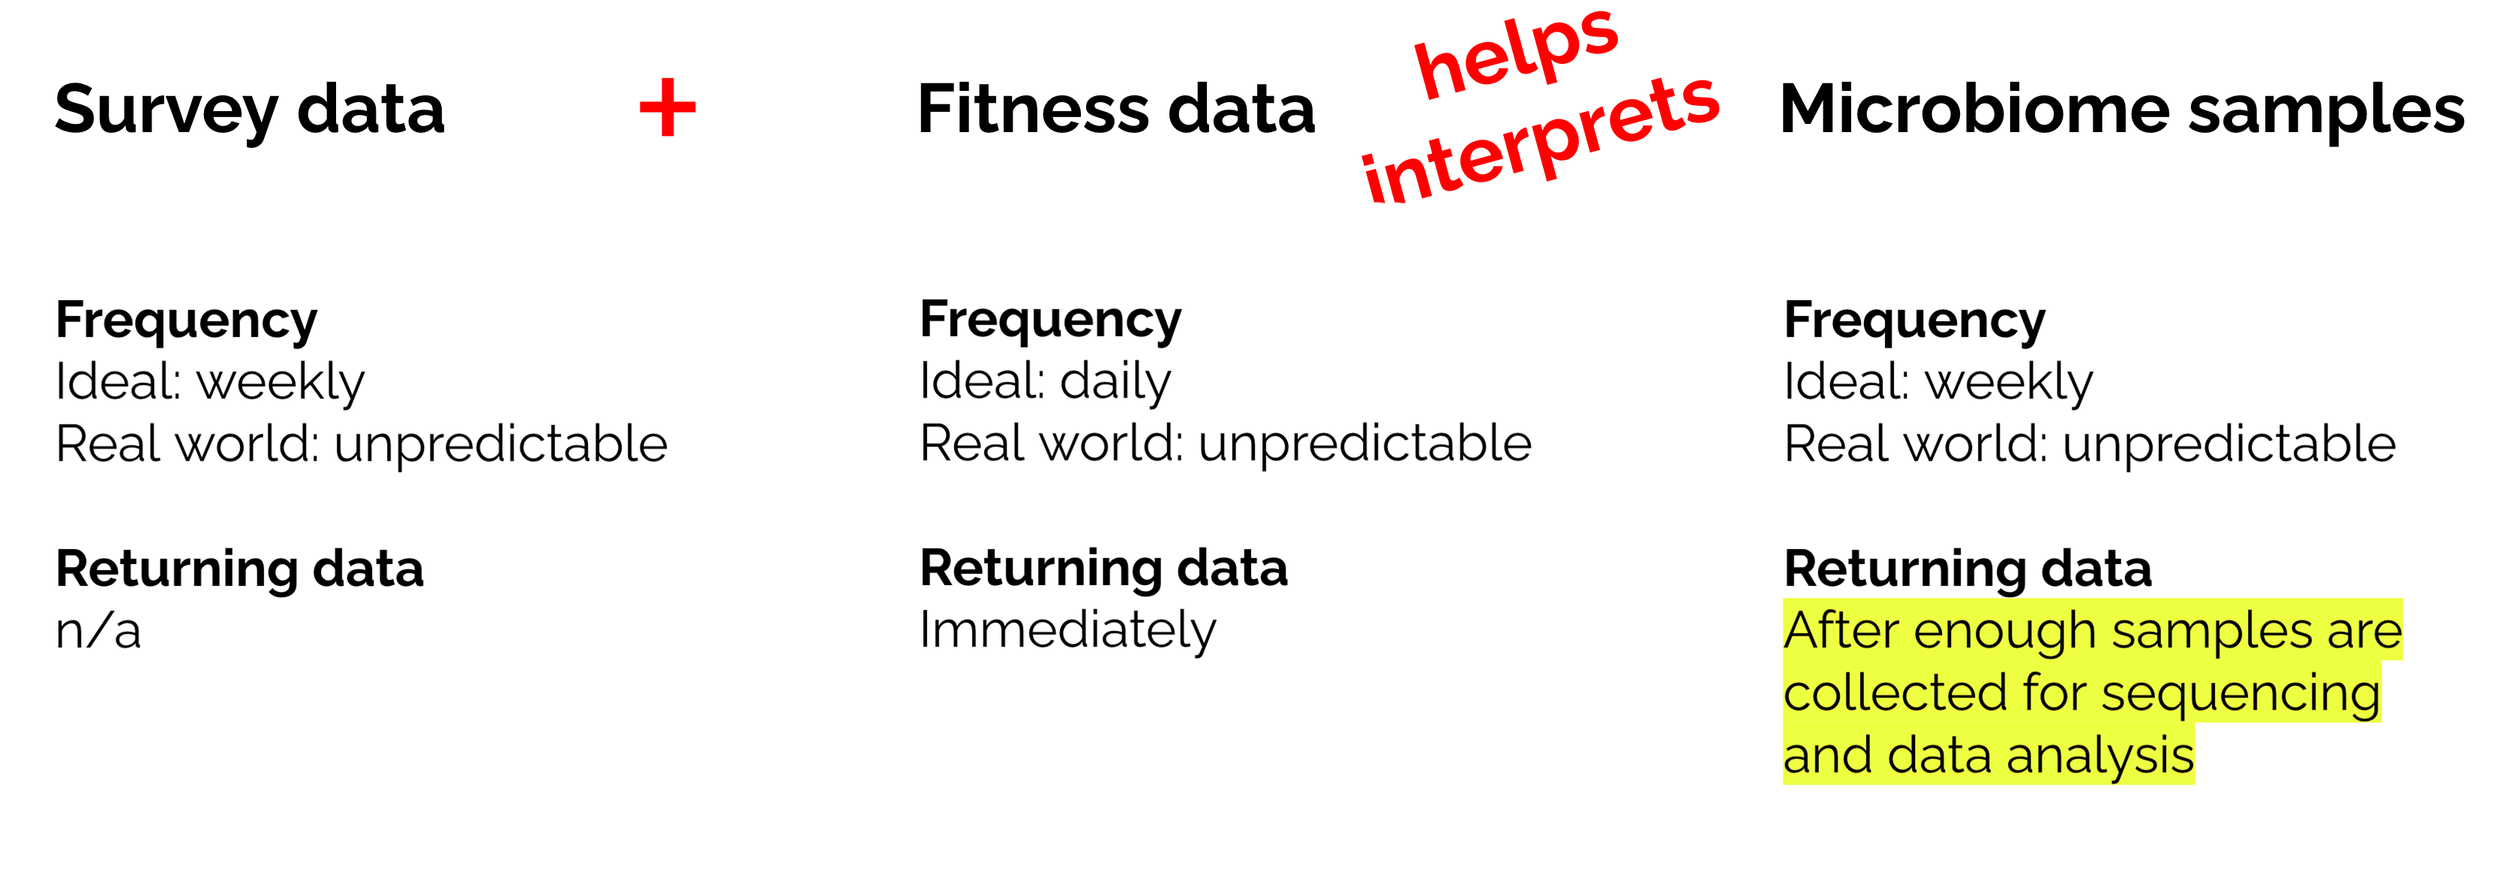
Returning data to the patients was the easy part, we can design any interface with any interactivity to answer all user needs. BUT the hard part was obtaining the data and the unknown frequency of it… how can we keep users engaged by returning useful data when we won’t know when we would have data to return? We can immediately return Fitbit data, but that’s the true value for our users. The true value was the data from the survey and microbiome samples, and these relied heavily on patient participation. On top of patient participation, the microbiome data to be cost effective for the lab running the study, we’d need to obtain 384 sample to sequence the samples. So for example if we had a minority of very involved patients and a majority of occasionally involved patients, the diligent patients will still need to wait for their data to be returned.
So how do you design for unpredictable user engagement?
We designed the app around the HOOKED Method of variable rewards:

From the onset of the development process, we request content from the researchers and clinicians, this would give us time to create enough content to deliver variable rewards until we would be able to return their own microbiome data to the users. We were just buying time to get enough samples to sequence the first run.
So the types of variable reward content we were writing:
Microbe of the week - we mapped out a phylogenetic tree of all bacteria found in the human gut and create profiles for the top percentile of microbes.
To get more value from all the work creating microbe profile, we plan on using snippets from the profiles for fun facts.
We would link to papers that CMIT would publish
We would also include alerts to any news on IBD
We also planned a timed-release of features, starting with on-boarding materials and then slowly introducing functionality and features of the application.
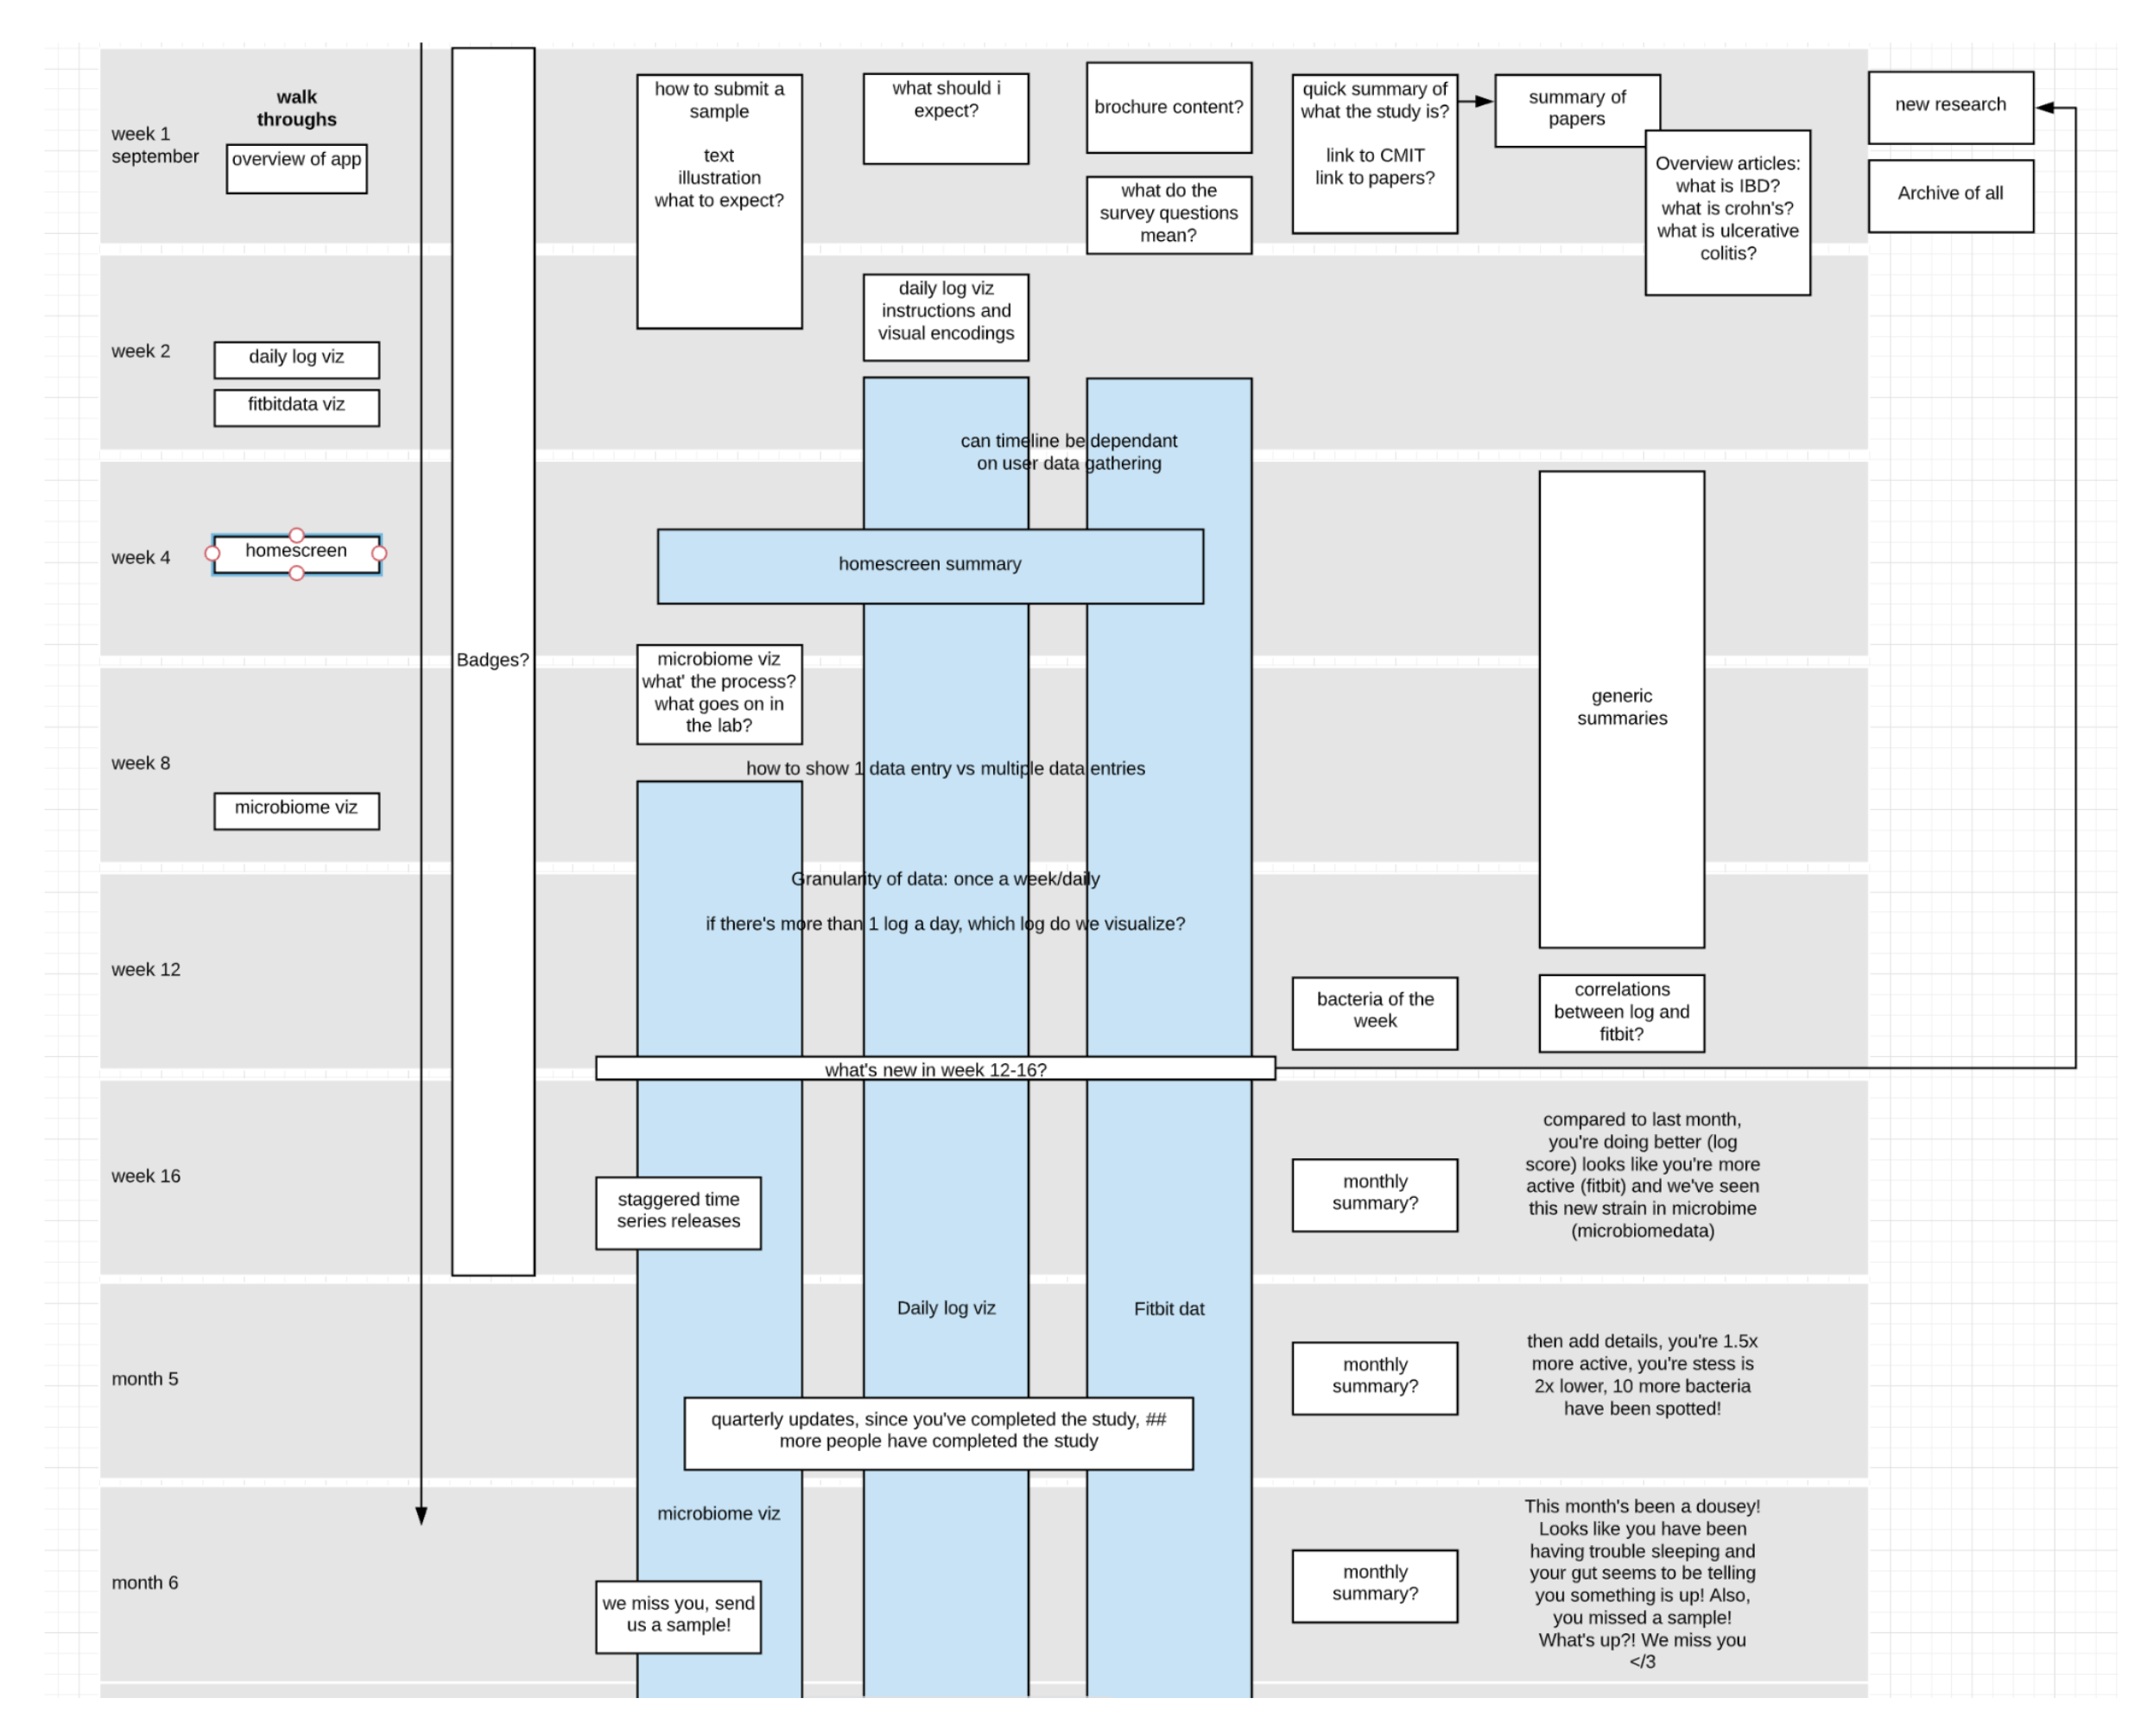
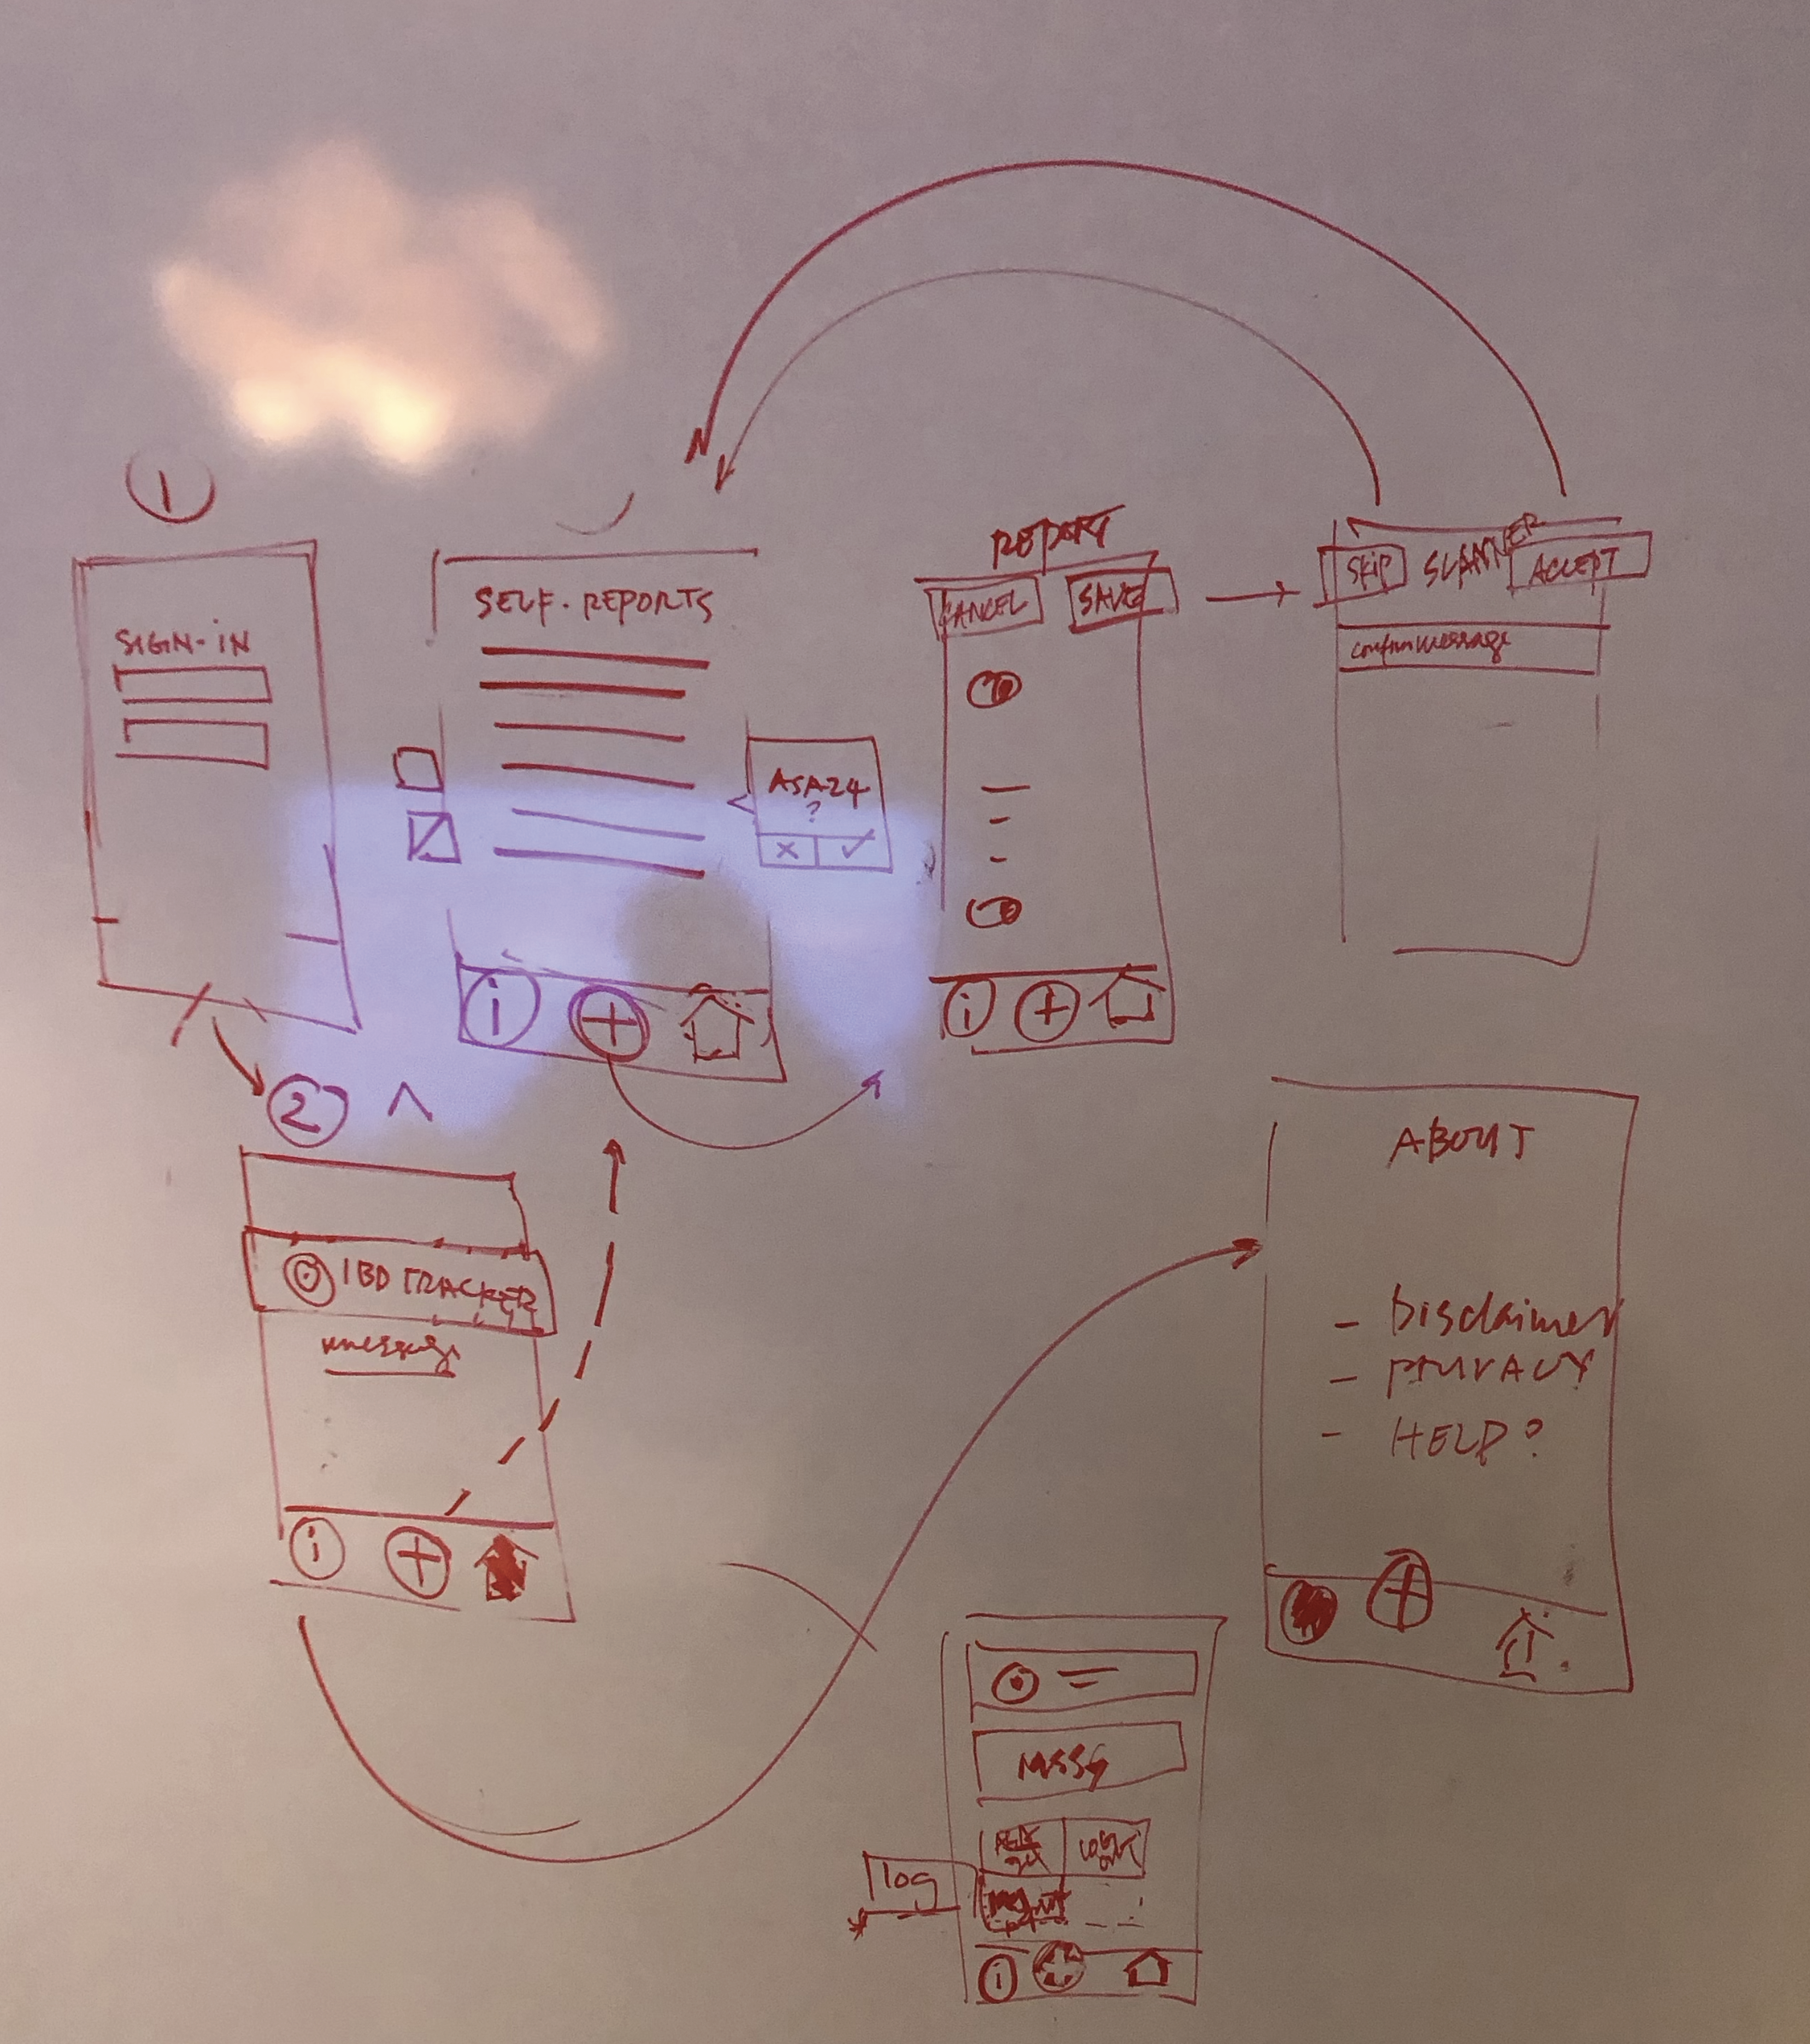
The design

Here’s an example of planning the site architecture to review with the stakeholders. Once we got the go ahead with the plan, and lots of sketching ideas with the team.

After initial sketches, time for digital sketches. Since this was mobile design, we had to familiarize ourselves with AppKit and touch interactions. We also experimented with light and dark modes and selected a color palette to visualize the data that would work independently from either of the modes and still pass accessibility test.
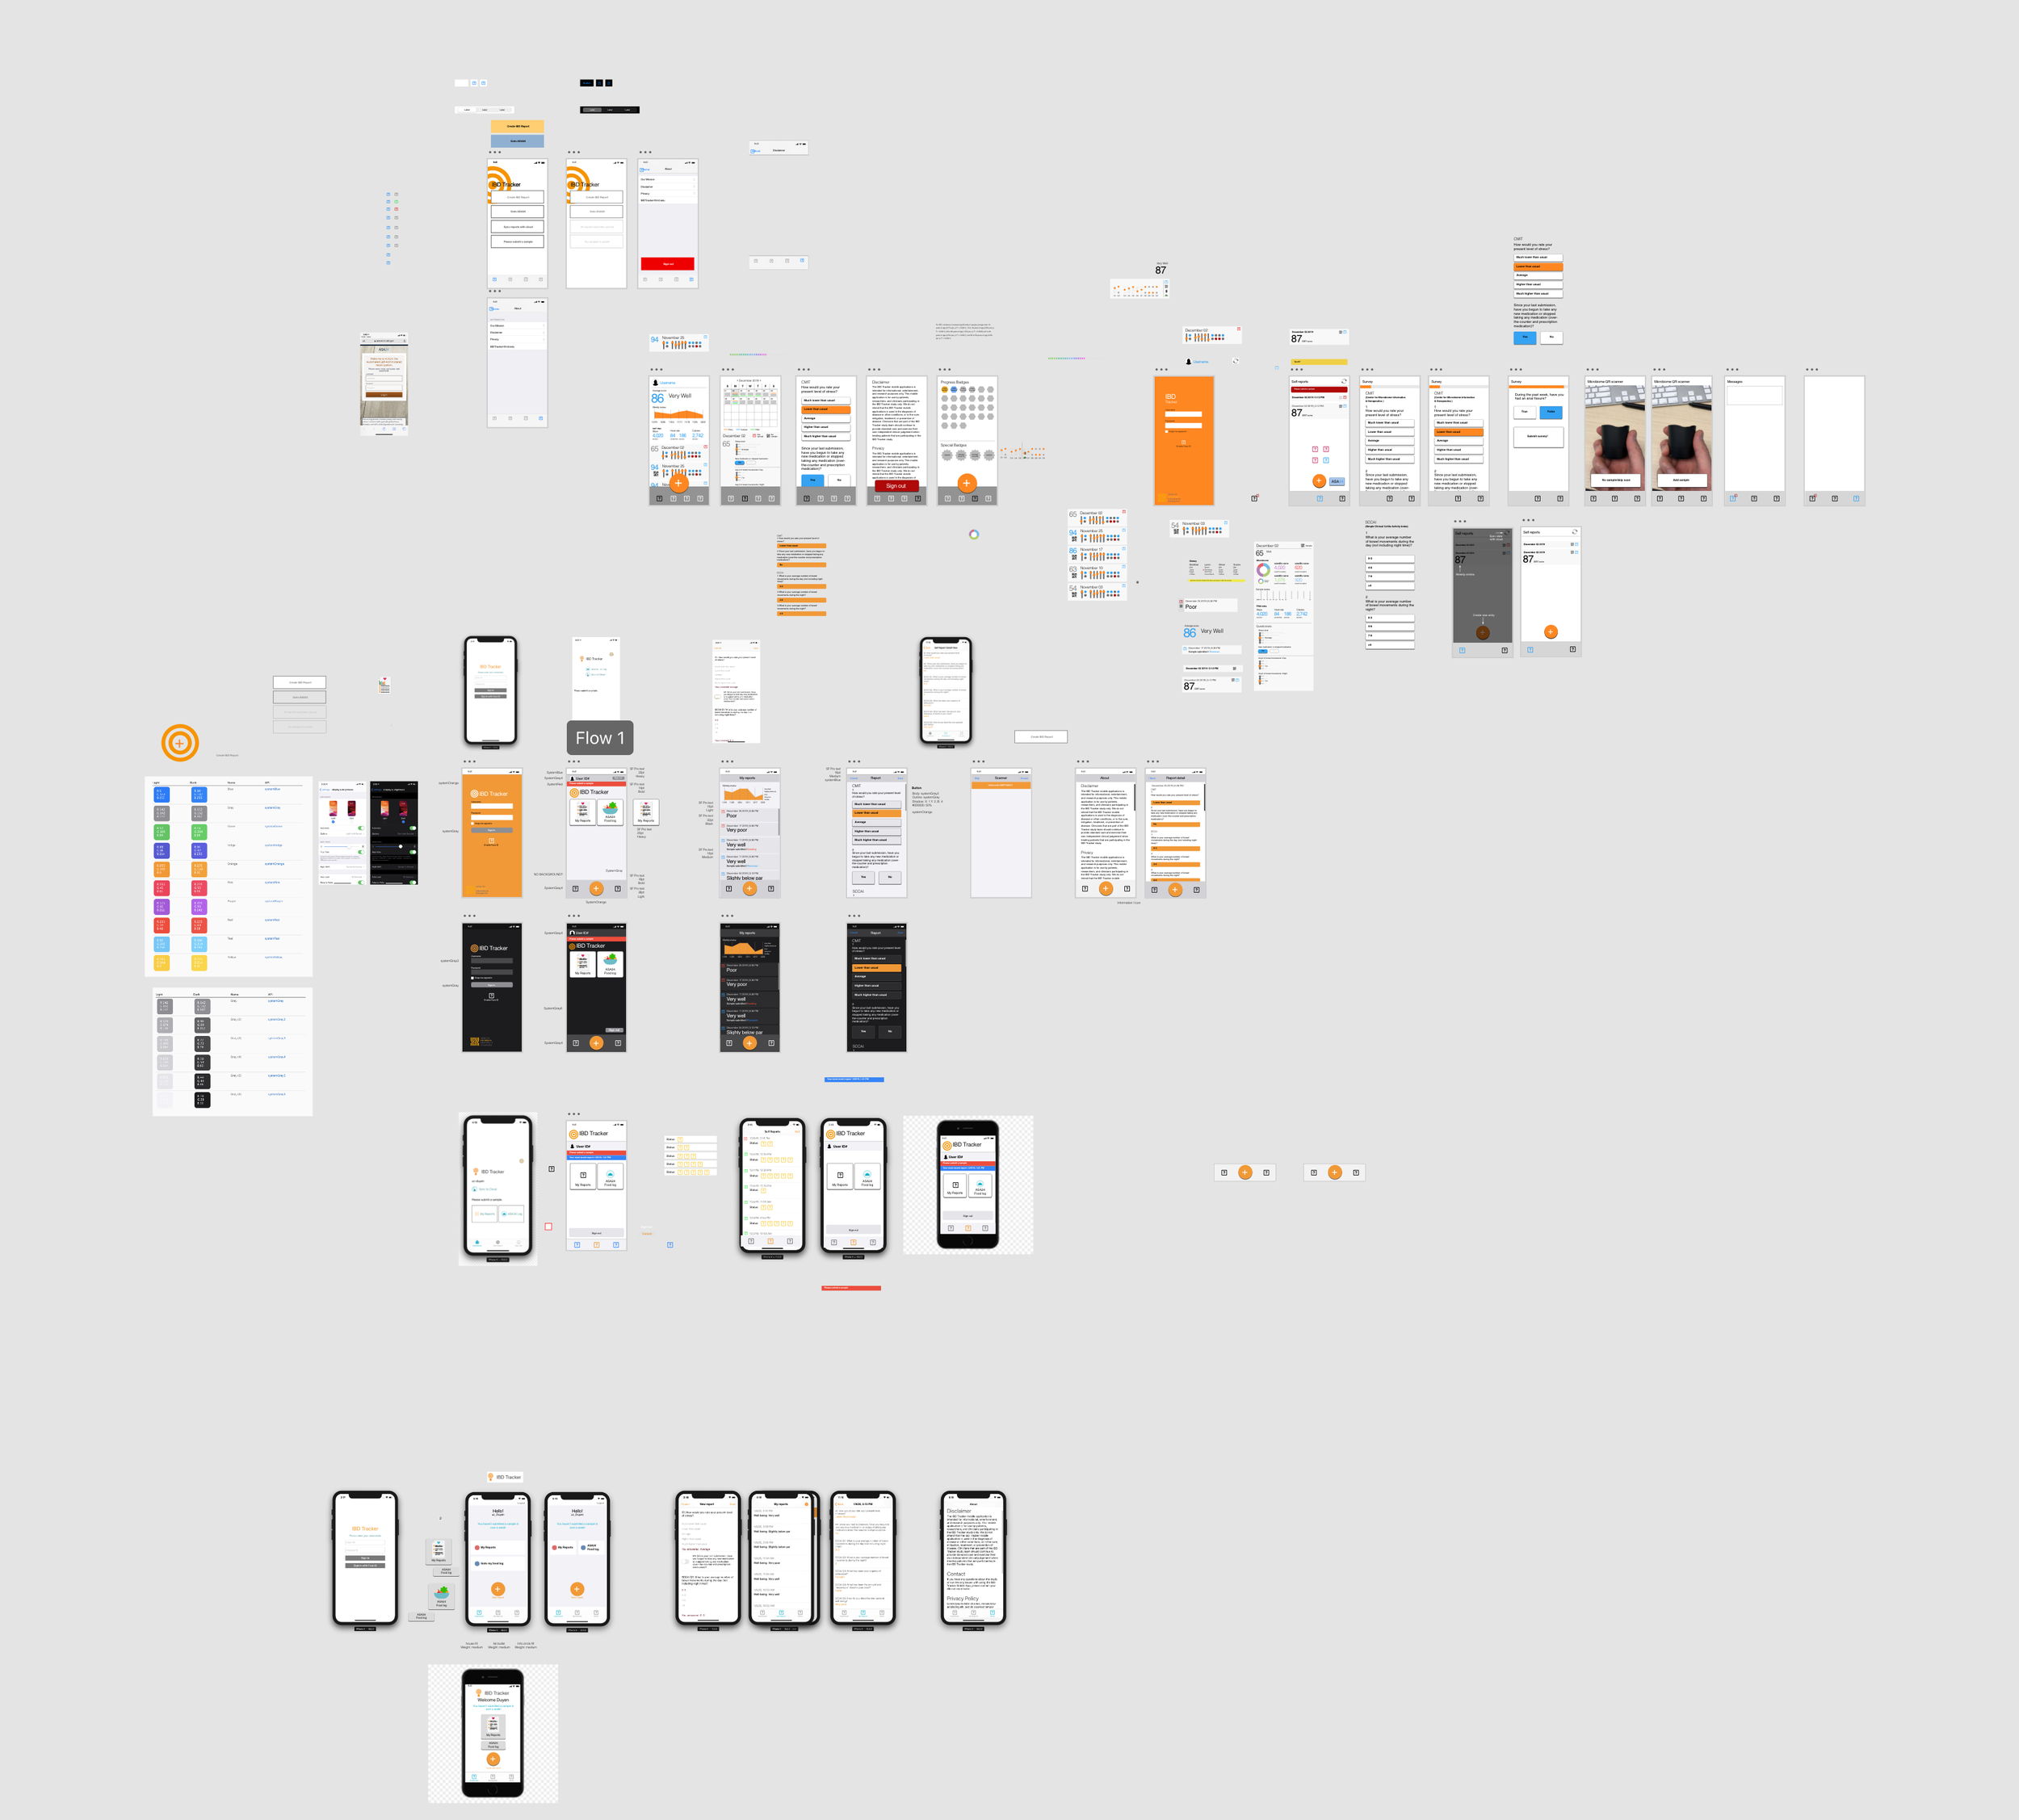


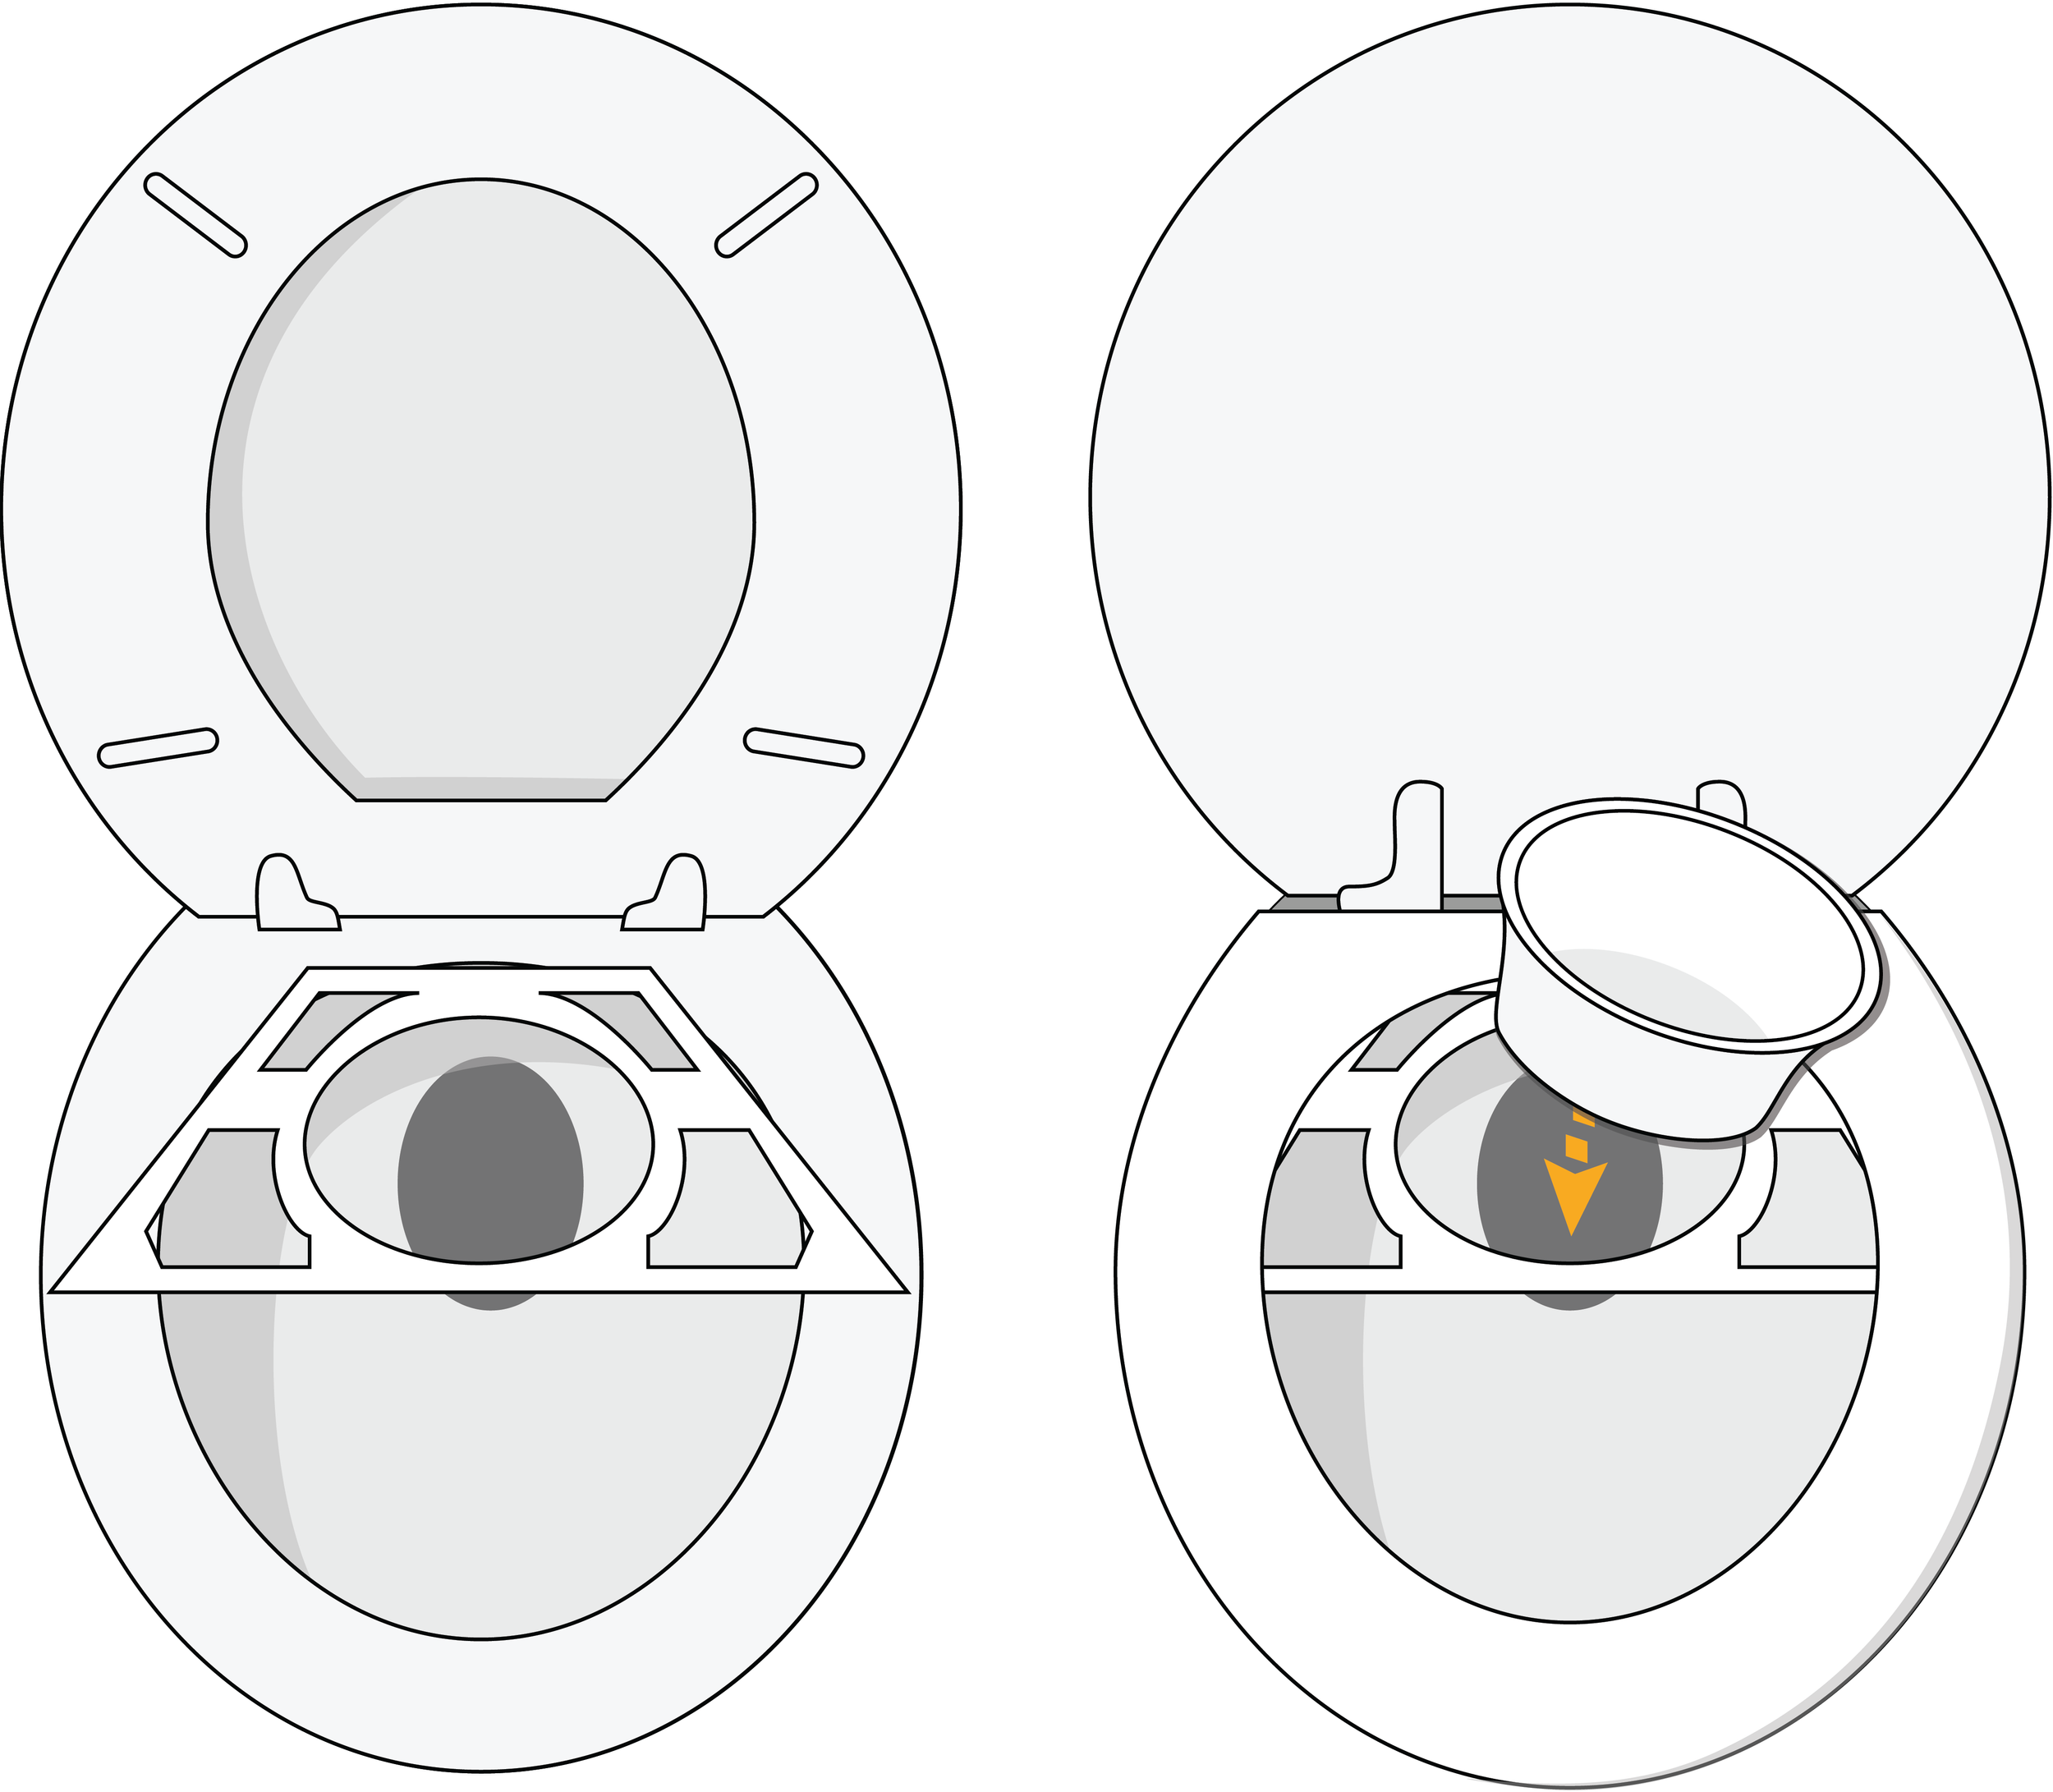
I even designed the user experience of the on-boarding materials and explainers. My background as an illustrator came in handy and I was able to create all the graphics for the materials.

The developers and I spent a lot of time iterating through the visualizations. Here’s an example of the type of questions we were trying to answer.

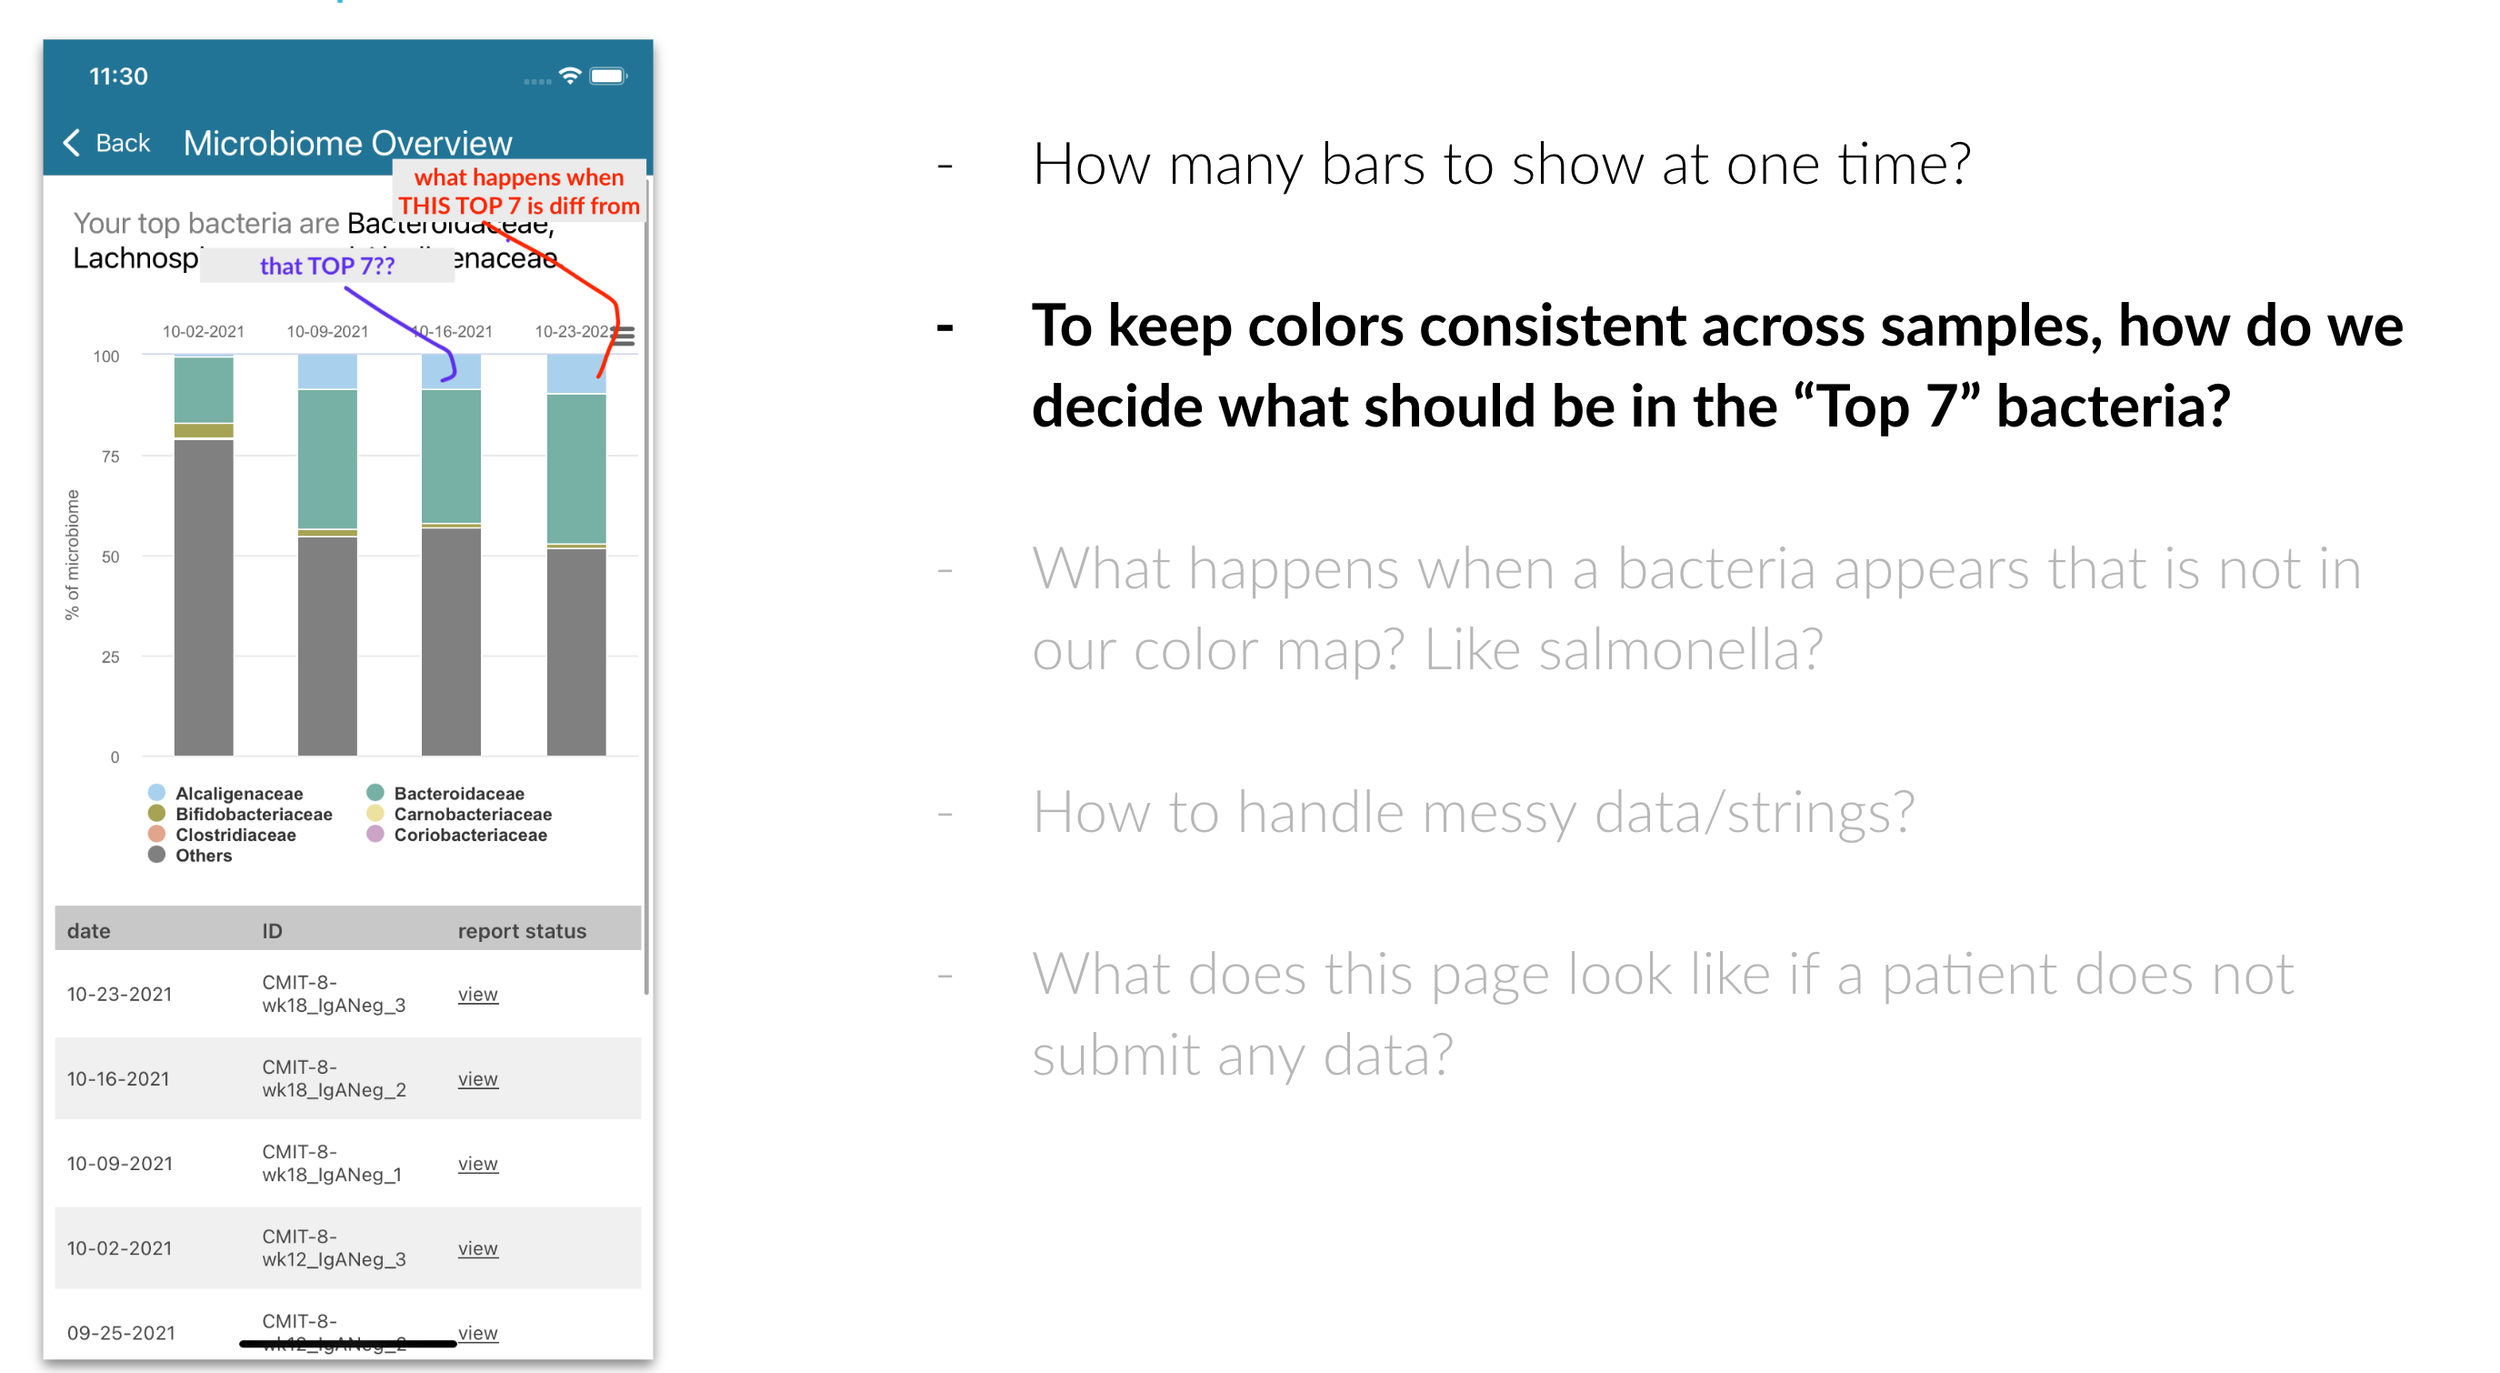


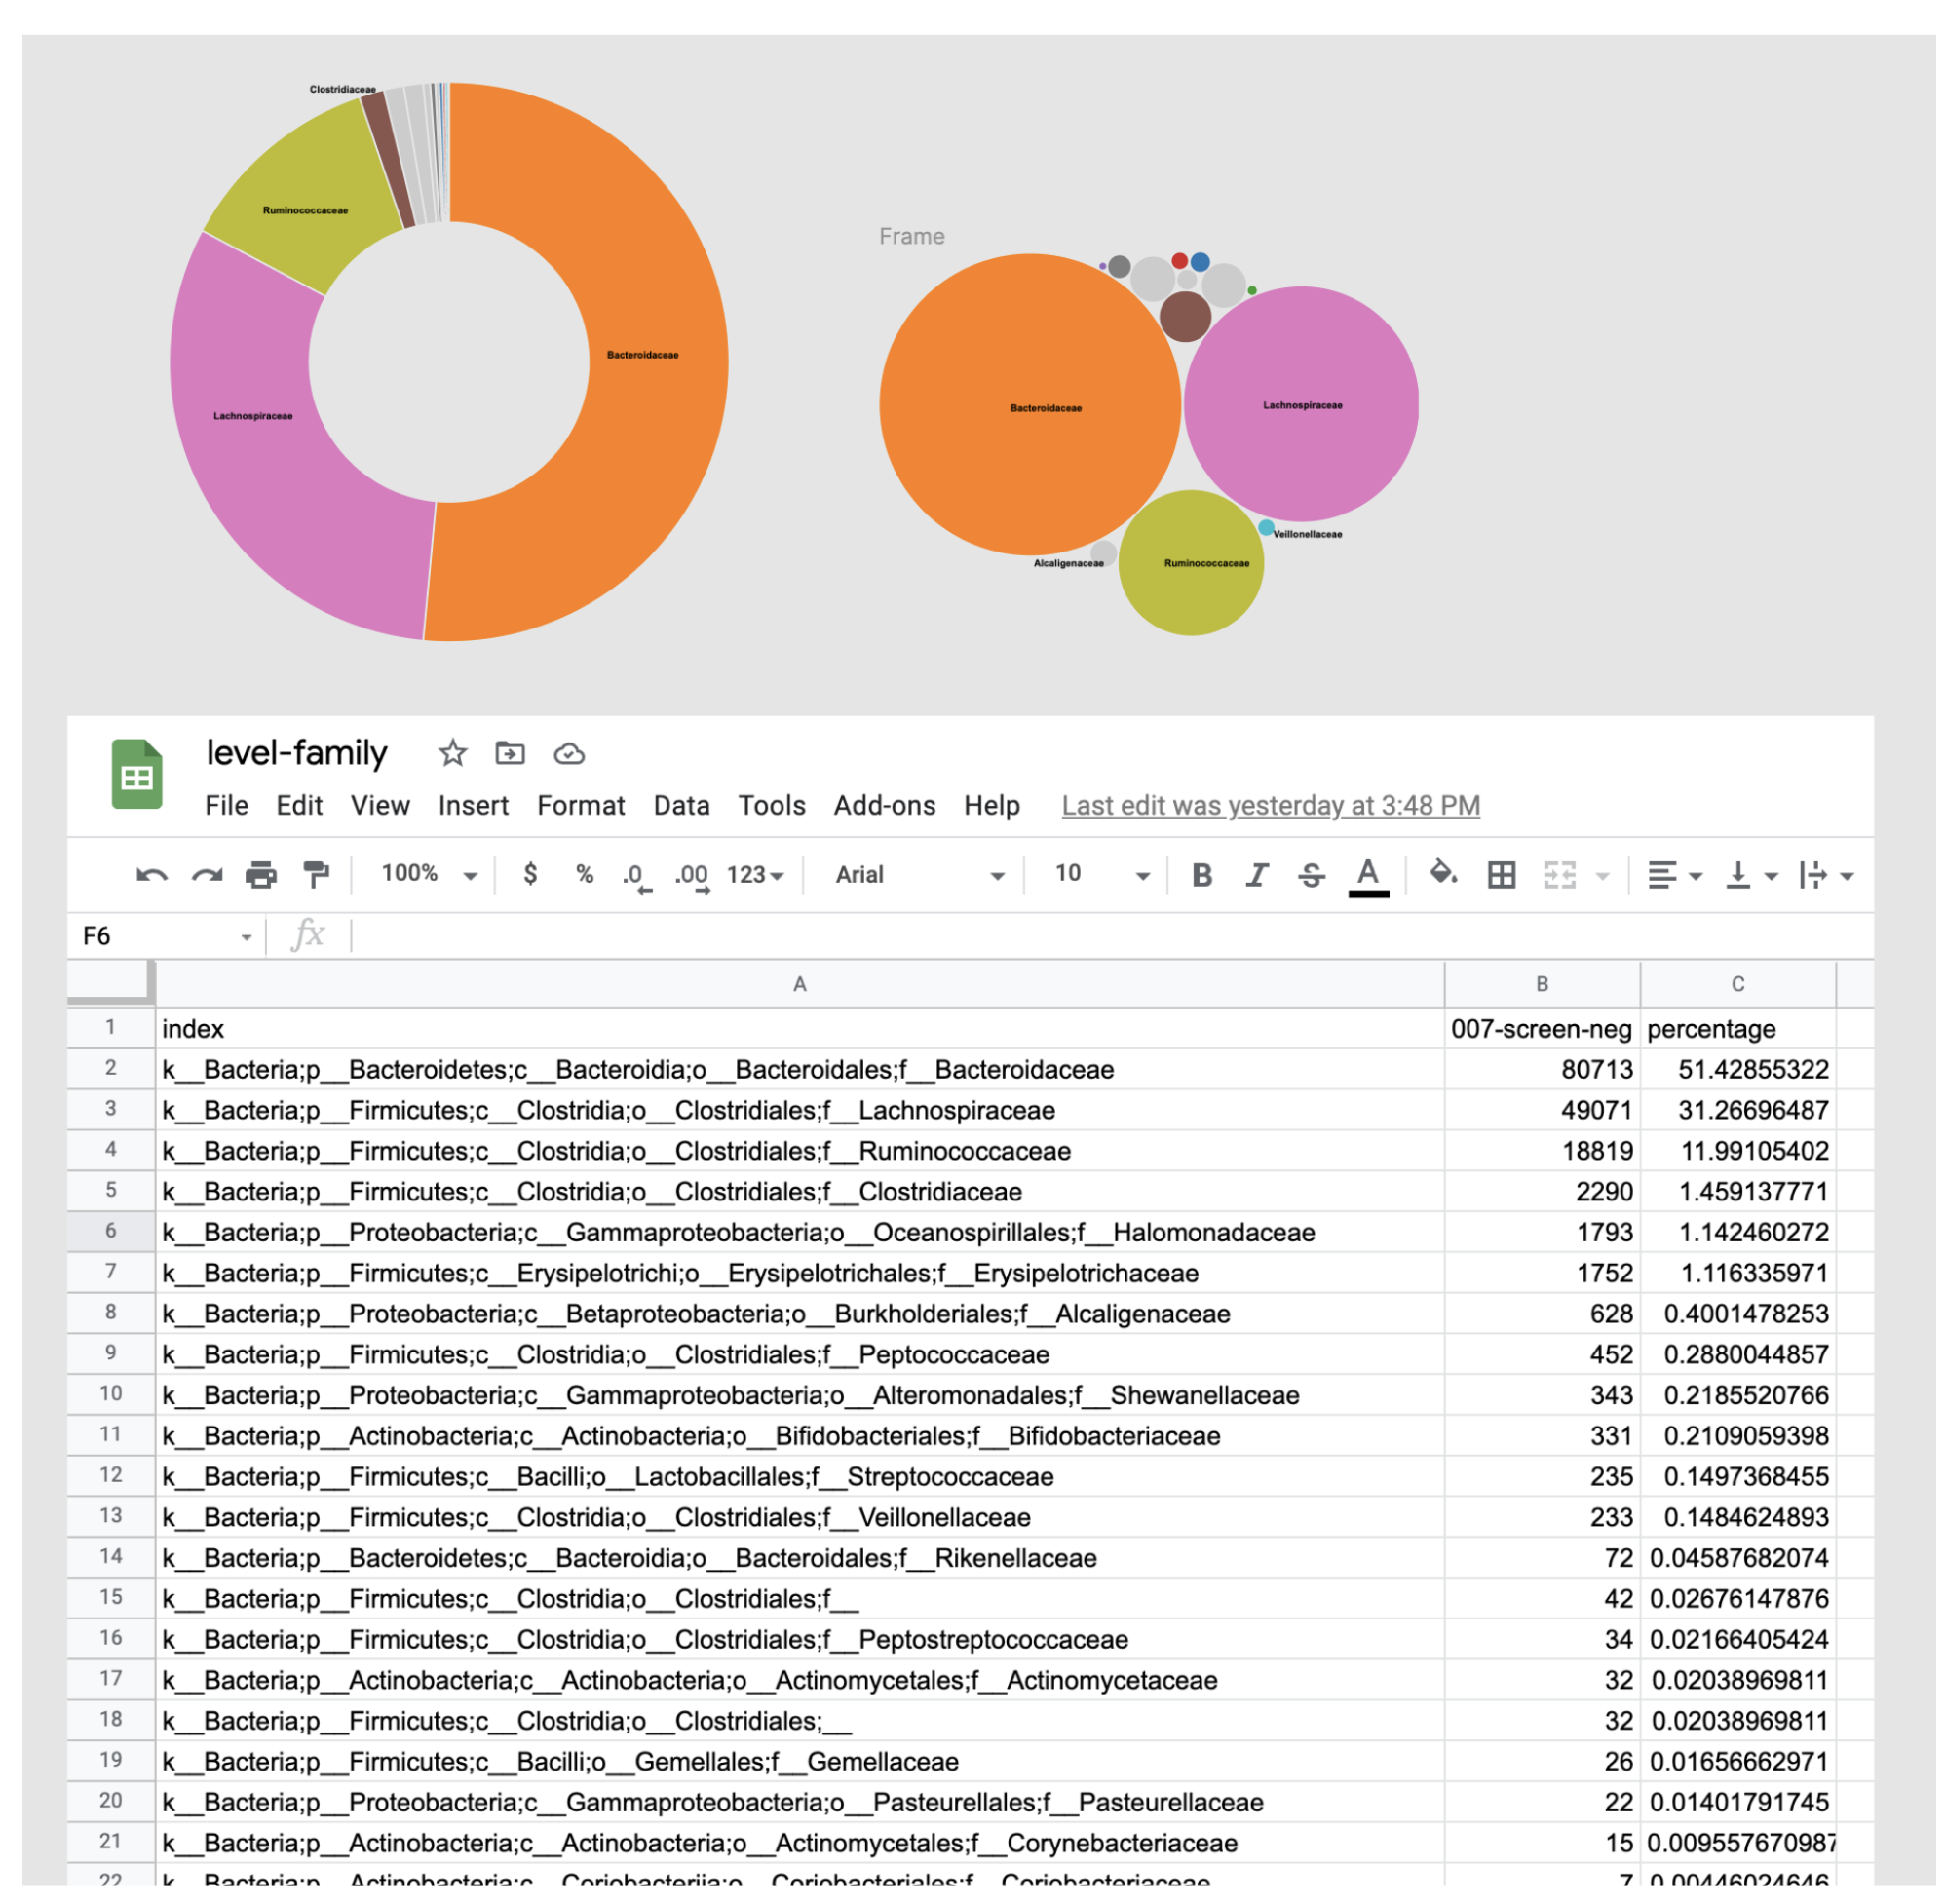
Examples of visualizations ideas we tried for showing abundance of bacteria.


The solution we decided on.
